Somali vs Immigrants from South Eastern Asia 5th Grade
COMPARE
Somali
Immigrants from South Eastern Asia
5th Grade
5th Grade Comparison
Somalis
Immigrants from South Eastern Asia
96.5%
5TH GRADE
0.0/ 100
METRIC RATING
292nd/ 347
METRIC RANK
96.3%
5TH GRADE
0.0/ 100
METRIC RATING
296th/ 347
METRIC RANK
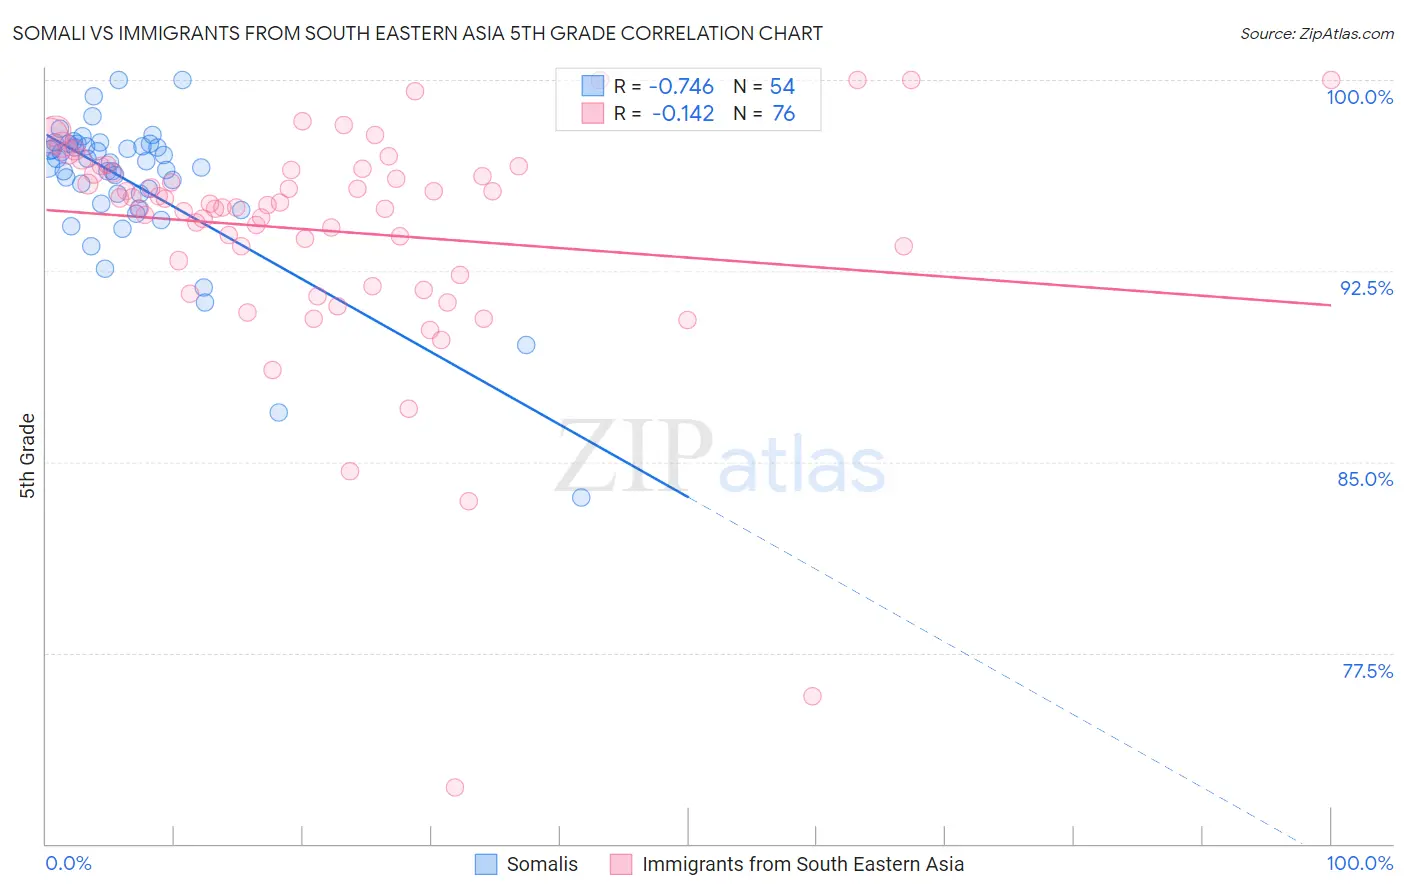
Somali vs Immigrants from South Eastern Asia 5th Grade Correlation Chart
The statistical analysis conducted on geographies consisting of 99,332,457 people shows a strong negative correlation between the proportion of Somalis and percentage of population with at least 5th grade education in the United States with a correlation coefficient (R) of -0.746 and weighted average of 96.5%. Similarly, the statistical analysis conducted on geographies consisting of 512,710,223 people shows a poor negative correlation between the proportion of Immigrants from South Eastern Asia and percentage of population with at least 5th grade education in the United States with a correlation coefficient (R) of -0.142 and weighted average of 96.3%, a difference of 0.19%.
5th Grade Correlation Summary
| Measurement | Somali | Immigrants from South Eastern Asia |
| Minimum | 83.6% | 72.2% |
| Maximum | 100.0% | 100.0% |
| Range | 16.4% | 27.8% |
| Mean | 95.9% | 94.1% |
| Median | 96.7% | 95.1% |
| Interquartile 25% (IQ1) | 95.1% | 92.6% |
| Interquartile 75% (IQ3) | 97.4% | 96.5% |
| Interquartile Range (IQR) | 2.3% | 3.9% |
| Standard Deviation (Sample) | 2.9% | 4.6% |
| Standard Deviation (Population) | 2.9% | 4.6% |
Demographics Similar to Somalis and Immigrants from South Eastern Asia by 5th Grade
In terms of 5th grade, the demographic groups most similar to Somalis are Malaysian (96.5%, a difference of 0.0%), British West Indian (96.5%, a difference of 0.010%), Immigrants from Grenada (96.5%, a difference of 0.010%), Immigrants from West Indies (96.5%, a difference of 0.020%), and Immigrants from Eritrea (96.4%, a difference of 0.050%). Similarly, the demographic groups most similar to Immigrants from South Eastern Asia are Haitian (96.3%, a difference of 0.030%), Immigrants from Dominica (96.2%, a difference of 0.080%), Immigrants from Somalia (96.4%, a difference of 0.10%), Immigrants (96.2%, a difference of 0.11%), and Immigrants from Eritrea (96.4%, a difference of 0.14%).
| Demographics | Rating | Rank | 5th Grade |
| Immigrants | Trinidad and Tobago | 0.1 /100 | #284 | Tragic 96.6% |
| Immigrants | St. Vincent and the Grenadines | 0.1 /100 | #285 | Tragic 96.6% |
| Immigrants | Thailand | 0.1 /100 | #286 | Tragic 96.6% |
| Immigrants | Afghanistan | 0.1 /100 | #287 | Tragic 96.6% |
| Immigrants | Barbados | 0.0 /100 | #288 | Tragic 96.6% |
| Immigrants | West Indies | 0.0 /100 | #289 | Tragic 96.5% |
| British West Indians | 0.0 /100 | #290 | Tragic 96.5% |
| Malaysians | 0.0 /100 | #291 | Tragic 96.5% |
| Somalis | 0.0 /100 | #292 | Tragic 96.5% |
| Immigrants | Grenada | 0.0 /100 | #293 | Tragic 96.5% |
| Immigrants | Eritrea | 0.0 /100 | #294 | Tragic 96.4% |
| Immigrants | Somalia | 0.0 /100 | #295 | Tragic 96.4% |
| Immigrants | South Eastern Asia | 0.0 /100 | #296 | Tragic 96.3% |
| Haitians | 0.0 /100 | #297 | Tragic 96.3% |
| Immigrants | Dominica | 0.0 /100 | #298 | Tragic 96.2% |
| Immigrants | Immigrants | 0.0 /100 | #299 | Tragic 96.2% |
| Sri Lankans | 0.0 /100 | #300 | Tragic 96.1% |
| Immigrants | Cuba | 0.0 /100 | #301 | Tragic 96.1% |
| Guyanese | 0.0 /100 | #302 | Tragic 96.1% |
| Puerto Ricans | 0.0 /100 | #303 | Tragic 96.1% |
| Immigrants | Burma/Myanmar | 0.0 /100 | #304 | Tragic 96.1% |