Alaskan Athabascan vs Fijian 5th Grade
COMPARE
Alaskan Athabascan
Fijian
5th Grade
5th Grade Comparison
Alaskan Athabascans
Fijians
98.3%
5TH GRADE
100.0/ 100
METRIC RATING
11th/ 347
METRIC RANK
96.6%
5TH GRADE
0.1/ 100
METRIC RATING
283rd/ 347
METRIC RANK
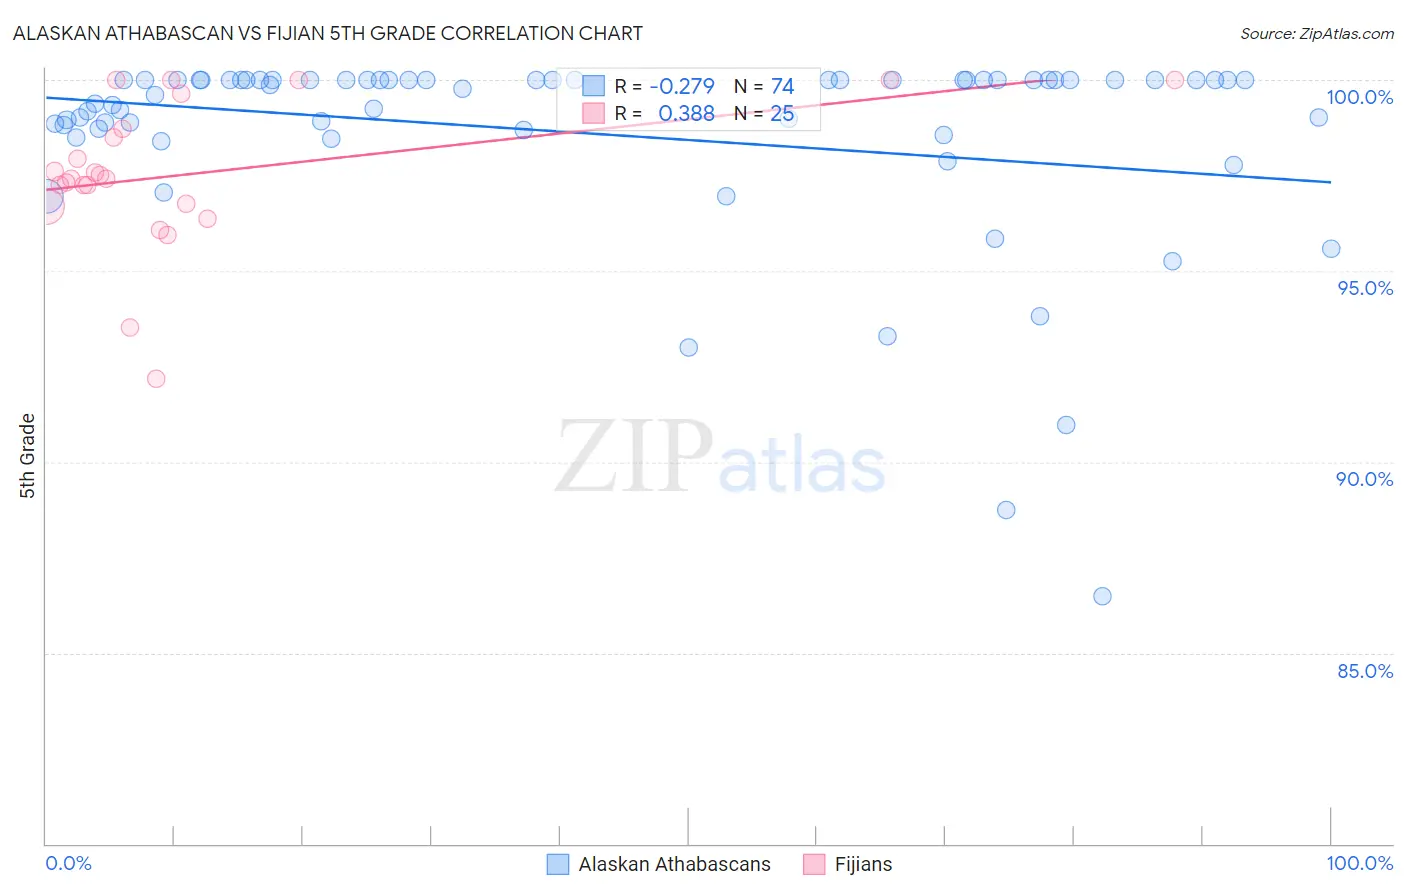
Alaskan Athabascan vs Fijian 5th Grade Correlation Chart
The statistical analysis conducted on geographies consisting of 45,820,365 people shows a weak negative correlation between the proportion of Alaskan Athabascans and percentage of population with at least 5th grade education in the United States with a correlation coefficient (R) of -0.279 and weighted average of 98.3%. Similarly, the statistical analysis conducted on geographies consisting of 55,948,842 people shows a mild positive correlation between the proportion of Fijians and percentage of population with at least 5th grade education in the United States with a correlation coefficient (R) of 0.388 and weighted average of 96.6%, a difference of 1.8%.
5th Grade Correlation Summary
| Measurement | Alaskan Athabascan | Fijian |
| Minimum | 86.5% | 92.2% |
| Maximum | 100.0% | 100.0% |
| Range | 13.5% | 7.8% |
| Mean | 98.6% | 97.6% |
| Median | 99.9% | 97.4% |
| Interquartile 25% (IQ1) | 98.7% | 96.7% |
| Interquartile 75% (IQ3) | 100.0% | 99.2% |
| Interquartile Range (IQR) | 1.3% | 2.4% |
| Standard Deviation (Sample) | 2.6% | 1.9% |
| Standard Deviation (Population) | 2.6% | 1.9% |
Similar Demographics by 5th Grade
Demographics Similar to Alaskan Athabascans by 5th Grade
In terms of 5th grade, the demographic groups most similar to Alaskan Athabascans are Swedish (98.3%, a difference of 0.0%), English (98.3%, a difference of 0.0%), Carpatho Rusyn (98.3%, a difference of 0.010%), Tlingit-Haida (98.3%, a difference of 0.020%), and Dutch (98.3%, a difference of 0.030%).
| Demographics | Rating | Rank | 5th Grade |
| Tsimshian | 100.0 /100 | #4 | Exceptional 98.4% |
| Slovaks | 100.0 /100 | #5 | Exceptional 98.4% |
| Germans | 100.0 /100 | #6 | Exceptional 98.4% |
| Inupiat | 100.0 /100 | #7 | Exceptional 98.4% |
| Slovenes | 100.0 /100 | #8 | Exceptional 98.3% |
| Swedes | 100.0 /100 | #9 | Exceptional 98.3% |
| English | 100.0 /100 | #10 | Exceptional 98.3% |
| Alaskan Athabascans | 100.0 /100 | #11 | Exceptional 98.3% |
| Carpatho Rusyns | 100.0 /100 | #12 | Exceptional 98.3% |
| Tlingit-Haida | 100.0 /100 | #13 | Exceptional 98.3% |
| Dutch | 100.0 /100 | #14 | Exceptional 98.3% |
| Scottish | 100.0 /100 | #15 | Exceptional 98.3% |
| Poles | 100.0 /100 | #16 | Exceptional 98.3% |
| Irish | 100.0 /100 | #17 | Exceptional 98.3% |
| Pennsylvania Germans | 100.0 /100 | #18 | Exceptional 98.3% |
Demographics Similar to Fijians by 5th Grade
In terms of 5th grade, the demographic groups most similar to Fijians are Immigrants from Western Africa (96.6%, a difference of 0.0%), Houma (96.6%, a difference of 0.0%), Barbadian (96.6%, a difference of 0.0%), Immigrants from Trinidad and Tobago (96.6%, a difference of 0.0%), and Immigrants from Philippines (96.6%, a difference of 0.010%).
| Demographics | Rating | Rank | 5th Grade |
| Cubans | 0.1 /100 | #276 | Tragic 96.6% |
| Immigrants | Bolivia | 0.1 /100 | #277 | Tragic 96.6% |
| Immigrants | Ghana | 0.1 /100 | #278 | Tragic 96.6% |
| Immigrants | Philippines | 0.1 /100 | #279 | Tragic 96.6% |
| Immigrants | Western Africa | 0.1 /100 | #280 | Tragic 96.6% |
| Houma | 0.1 /100 | #281 | Tragic 96.6% |
| Barbadians | 0.1 /100 | #282 | Tragic 96.6% |
| Fijians | 0.1 /100 | #283 | Tragic 96.6% |
| Immigrants | Trinidad and Tobago | 0.1 /100 | #284 | Tragic 96.6% |
| Immigrants | St. Vincent and the Grenadines | 0.1 /100 | #285 | Tragic 96.6% |
| Immigrants | Thailand | 0.1 /100 | #286 | Tragic 96.6% |
| Immigrants | Afghanistan | 0.1 /100 | #287 | Tragic 96.6% |
| Immigrants | Barbados | 0.0 /100 | #288 | Tragic 96.6% |
| Immigrants | West Indies | 0.0 /100 | #289 | Tragic 96.5% |
| British West Indians | 0.0 /100 | #290 | Tragic 96.5% |