Dominican vs Immigrants from South Eastern Asia 5th Grade
COMPARE
Dominican
Immigrants from South Eastern Asia
5th Grade
5th Grade Comparison
Dominicans
Immigrants from South Eastern Asia
95.5%
5TH GRADE
0.0/ 100
METRIC RATING
327th/ 347
METRIC RANK
96.3%
5TH GRADE
0.0/ 100
METRIC RATING
296th/ 347
METRIC RANK
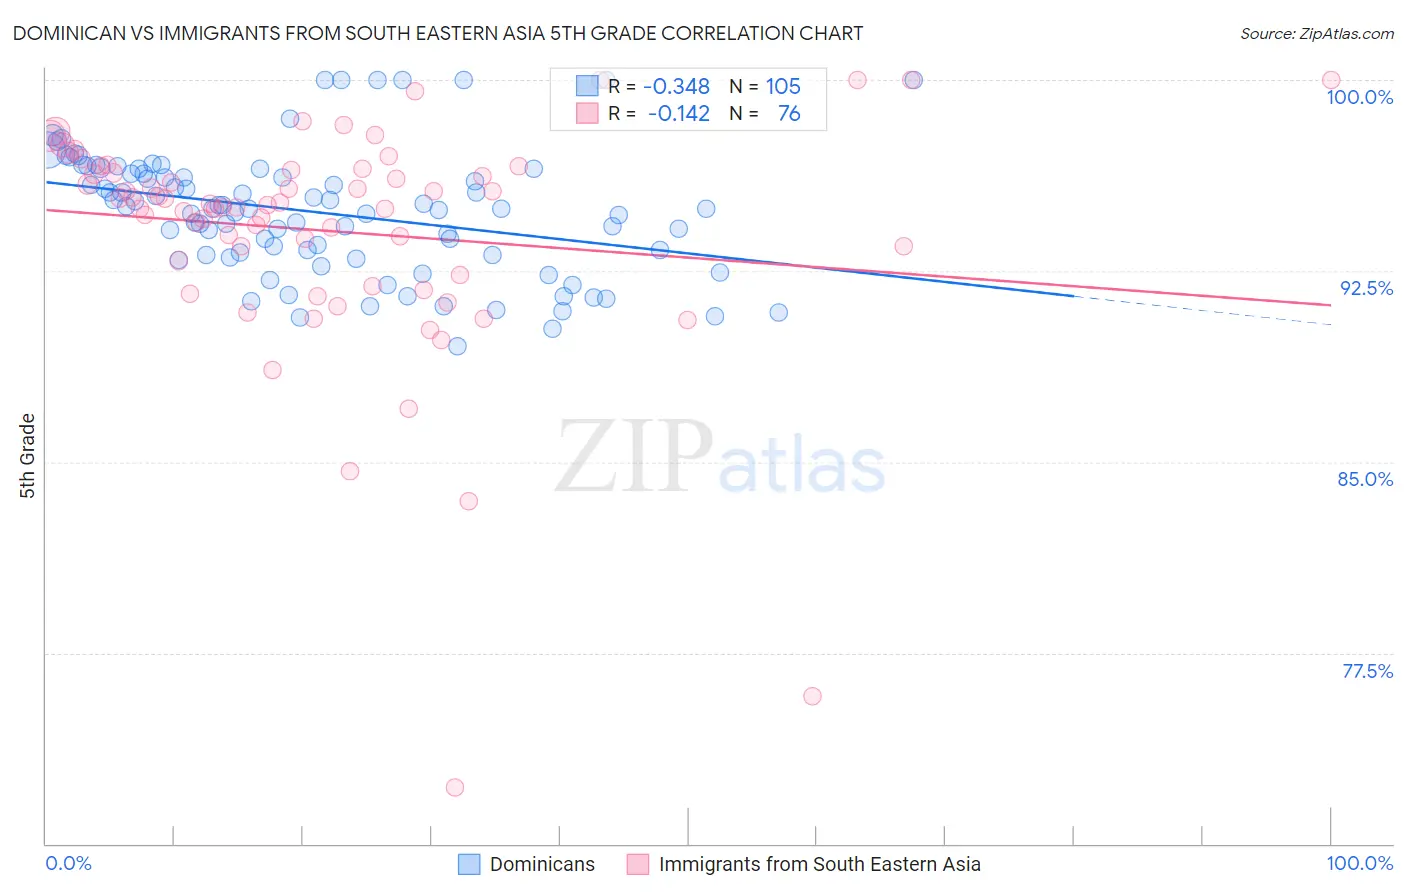
Dominican vs Immigrants from South Eastern Asia 5th Grade Correlation Chart
The statistical analysis conducted on geographies consisting of 355,142,603 people shows a mild negative correlation between the proportion of Dominicans and percentage of population with at least 5th grade education in the United States with a correlation coefficient (R) of -0.348 and weighted average of 95.5%. Similarly, the statistical analysis conducted on geographies consisting of 512,710,223 people shows a poor negative correlation between the proportion of Immigrants from South Eastern Asia and percentage of population with at least 5th grade education in the United States with a correlation coefficient (R) of -0.142 and weighted average of 96.3%, a difference of 0.78%.
5th Grade Correlation Summary
| Measurement | Dominican | Immigrants from South Eastern Asia |
| Minimum | 89.6% | 72.2% |
| Maximum | 100.0% | 100.0% |
| Range | 10.4% | 27.8% |
| Mean | 94.8% | 94.1% |
| Median | 95.0% | 95.1% |
| Interquartile 25% (IQ1) | 93.1% | 92.6% |
| Interquartile 75% (IQ3) | 96.4% | 96.5% |
| Interquartile Range (IQR) | 3.3% | 3.9% |
| Standard Deviation (Sample) | 2.4% | 4.6% |
| Standard Deviation (Population) | 2.4% | 4.6% |
Similar Demographics by 5th Grade
Demographics Similar to Dominicans by 5th Grade
In terms of 5th grade, the demographic groups most similar to Dominicans are Immigrants from Cambodia (95.5%, a difference of 0.0%), Honduran (95.6%, a difference of 0.030%), Hispanic or Latino (95.6%, a difference of 0.030%), Cape Verdean (95.5%, a difference of 0.030%), and Mexican American Indian (95.5%, a difference of 0.040%).
| Demographics | Rating | Rank | 5th Grade |
| Central American Indians | 0.0 /100 | #320 | Tragic 95.7% |
| Immigrants | Belize | 0.0 /100 | #321 | Tragic 95.7% |
| Immigrants | Nicaragua | 0.0 /100 | #322 | Tragic 95.6% |
| Immigrants | Fiji | 0.0 /100 | #323 | Tragic 95.6% |
| Hondurans | 0.0 /100 | #324 | Tragic 95.6% |
| Hispanics or Latinos | 0.0 /100 | #325 | Tragic 95.6% |
| Immigrants | Cambodia | 0.0 /100 | #326 | Tragic 95.5% |
| Dominicans | 0.0 /100 | #327 | Tragic 95.5% |
| Cape Verdeans | 0.0 /100 | #328 | Tragic 95.5% |
| Mexican American Indians | 0.0 /100 | #329 | Tragic 95.5% |
| Immigrants | Armenia | 0.0 /100 | #330 | Tragic 95.4% |
| Immigrants | Honduras | 0.0 /100 | #331 | Tragic 95.4% |
| Immigrants | Dominican Republic | 0.0 /100 | #332 | Tragic 95.3% |
| Immigrants | Latin America | 0.0 /100 | #333 | Tragic 95.3% |
| Nepalese | 0.0 /100 | #334 | Tragic 95.2% |
Demographics Similar to Immigrants from South Eastern Asia by 5th Grade
In terms of 5th grade, the demographic groups most similar to Immigrants from South Eastern Asia are Haitian (96.3%, a difference of 0.030%), Immigrants from Dominica (96.2%, a difference of 0.080%), Immigrants from Somalia (96.4%, a difference of 0.10%), Immigrants (96.2%, a difference of 0.11%), and Immigrants from Eritrea (96.4%, a difference of 0.14%).
| Demographics | Rating | Rank | 5th Grade |
| Immigrants | West Indies | 0.0 /100 | #289 | Tragic 96.5% |
| British West Indians | 0.0 /100 | #290 | Tragic 96.5% |
| Malaysians | 0.0 /100 | #291 | Tragic 96.5% |
| Somalis | 0.0 /100 | #292 | Tragic 96.5% |
| Immigrants | Grenada | 0.0 /100 | #293 | Tragic 96.5% |
| Immigrants | Eritrea | 0.0 /100 | #294 | Tragic 96.4% |
| Immigrants | Somalia | 0.0 /100 | #295 | Tragic 96.4% |
| Immigrants | South Eastern Asia | 0.0 /100 | #296 | Tragic 96.3% |
| Haitians | 0.0 /100 | #297 | Tragic 96.3% |
| Immigrants | Dominica | 0.0 /100 | #298 | Tragic 96.2% |
| Immigrants | Immigrants | 0.0 /100 | #299 | Tragic 96.2% |
| Sri Lankans | 0.0 /100 | #300 | Tragic 96.1% |
| Immigrants | Cuba | 0.0 /100 | #301 | Tragic 96.1% |
| Guyanese | 0.0 /100 | #302 | Tragic 96.1% |
| Puerto Ricans | 0.0 /100 | #303 | Tragic 96.1% |