Mongolian vs Immigrants from South Eastern Asia 5th Grade
COMPARE
Mongolian
Immigrants from South Eastern Asia
5th Grade
5th Grade Comparison
Mongolians
Immigrants from South Eastern Asia
97.3%
5TH GRADE
39.4/ 100
METRIC RATING
182nd/ 347
METRIC RANK
96.3%
5TH GRADE
0.0/ 100
METRIC RATING
296th/ 347
METRIC RANK
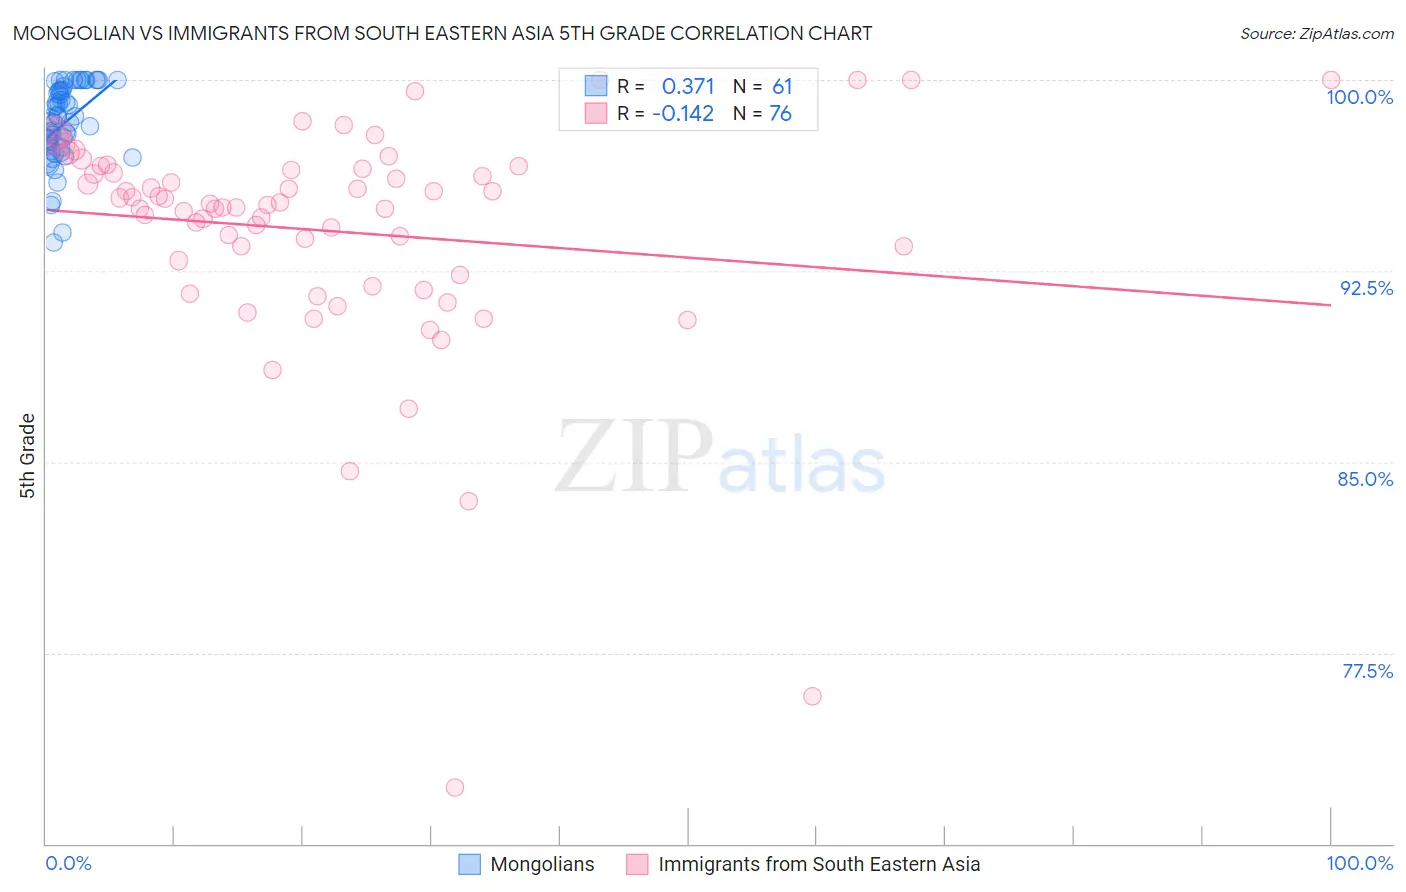
Mongolian vs Immigrants from South Eastern Asia 5th Grade Correlation Chart
The statistical analysis conducted on geographies consisting of 140,362,004 people shows a mild positive correlation between the proportion of Mongolians and percentage of population with at least 5th grade education in the United States with a correlation coefficient (R) of 0.371 and weighted average of 97.3%. Similarly, the statistical analysis conducted on geographies consisting of 512,710,223 people shows a poor negative correlation between the proportion of Immigrants from South Eastern Asia and percentage of population with at least 5th grade education in the United States with a correlation coefficient (R) of -0.142 and weighted average of 96.3%, a difference of 1.0%.
5th Grade Correlation Summary
| Measurement | Mongolian | Immigrants from South Eastern Asia |
| Minimum | 93.6% | 72.2% |
| Maximum | 100.0% | 100.0% |
| Range | 6.4% | 27.8% |
| Mean | 98.3% | 94.1% |
| Median | 98.5% | 95.1% |
| Interquartile 25% (IQ1) | 97.4% | 92.6% |
| Interquartile 75% (IQ3) | 99.6% | 96.5% |
| Interquartile Range (IQR) | 2.2% | 3.9% |
| Standard Deviation (Sample) | 1.5% | 4.6% |
| Standard Deviation (Population) | 1.5% | 4.6% |
Similar Demographics by 5th Grade
Demographics Similar to Mongolians by 5th Grade
In terms of 5th grade, the demographic groups most similar to Mongolians are Immigrants from Kenya (97.3%, a difference of 0.0%), Pakistani (97.3%, a difference of 0.0%), Argentinean (97.3%, a difference of 0.0%), Immigrants from Ukraine (97.3%, a difference of 0.0%), and Immigrants from Venezuela (97.3%, a difference of 0.0%).
| Demographics | Rating | Rank | 5th Grade |
| Immigrants | Micronesia | 48.8 /100 | #175 | Average 97.3% |
| Immigrants | Taiwan | 48.4 /100 | #176 | Average 97.3% |
| Immigrants | Spain | 47.0 /100 | #177 | Average 97.3% |
| Comanche | 42.1 /100 | #178 | Average 97.3% |
| Immigrants | Kenya | 40.3 /100 | #179 | Average 97.3% |
| Pakistanis | 40.2 /100 | #180 | Average 97.3% |
| Argentineans | 39.5 /100 | #181 | Fair 97.3% |
| Mongolians | 39.4 /100 | #182 | Fair 97.3% |
| Immigrants | Ukraine | 38.6 /100 | #183 | Fair 97.3% |
| Immigrants | Venezuela | 38.4 /100 | #184 | Fair 97.3% |
| Dutch West Indians | 36.2 /100 | #185 | Fair 97.3% |
| Immigrants | Argentina | 36.1 /100 | #186 | Fair 97.3% |
| Spanish Americans | 34.7 /100 | #187 | Fair 97.3% |
| Paraguayans | 33.7 /100 | #188 | Fair 97.3% |
| Immigrants | Egypt | 32.9 /100 | #189 | Fair 97.3% |
Demographics Similar to Immigrants from South Eastern Asia by 5th Grade
In terms of 5th grade, the demographic groups most similar to Immigrants from South Eastern Asia are Haitian (96.3%, a difference of 0.030%), Immigrants from Dominica (96.2%, a difference of 0.080%), Immigrants from Somalia (96.4%, a difference of 0.10%), Immigrants (96.2%, a difference of 0.11%), and Immigrants from Eritrea (96.4%, a difference of 0.14%).
| Demographics | Rating | Rank | 5th Grade |
| Immigrants | West Indies | 0.0 /100 | #289 | Tragic 96.5% |
| British West Indians | 0.0 /100 | #290 | Tragic 96.5% |
| Malaysians | 0.0 /100 | #291 | Tragic 96.5% |
| Somalis | 0.0 /100 | #292 | Tragic 96.5% |
| Immigrants | Grenada | 0.0 /100 | #293 | Tragic 96.5% |
| Immigrants | Eritrea | 0.0 /100 | #294 | Tragic 96.4% |
| Immigrants | Somalia | 0.0 /100 | #295 | Tragic 96.4% |
| Immigrants | South Eastern Asia | 0.0 /100 | #296 | Tragic 96.3% |
| Haitians | 0.0 /100 | #297 | Tragic 96.3% |
| Immigrants | Dominica | 0.0 /100 | #298 | Tragic 96.2% |
| Immigrants | Immigrants | 0.0 /100 | #299 | Tragic 96.2% |
| Sri Lankans | 0.0 /100 | #300 | Tragic 96.1% |
| Immigrants | Cuba | 0.0 /100 | #301 | Tragic 96.1% |
| Guyanese | 0.0 /100 | #302 | Tragic 96.1% |
| Puerto Ricans | 0.0 /100 | #303 | Tragic 96.1% |