Immigrants from Caribbean vs Immigrants from Ghana Associate's Degree
COMPARE
Immigrants from Caribbean
Immigrants from Ghana
Associate's Degree
Associate's Degree Comparison
Immigrants from Caribbean
Immigrants from Ghana
39.7%
ASSOCIATE'S DEGREE
0.0/ 100
METRIC RATING
286th/ 347
METRIC RANK
44.8%
ASSOCIATE'S DEGREE
14.2/ 100
METRIC RATING
213th/ 347
METRIC RANK
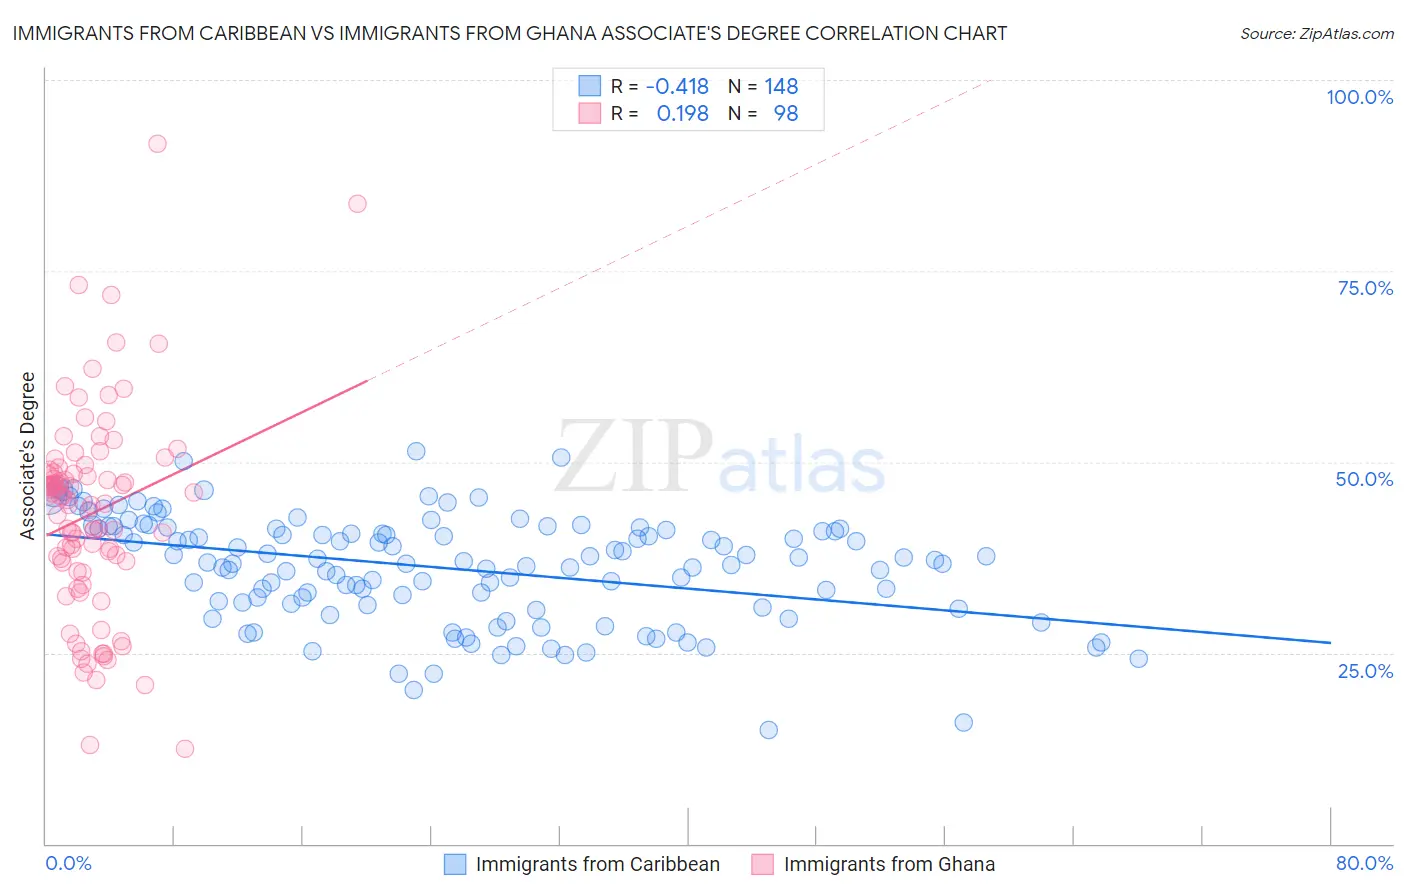
Immigrants from Caribbean vs Immigrants from Ghana Associate's Degree Correlation Chart
The statistical analysis conducted on geographies consisting of 450,016,404 people shows a moderate negative correlation between the proportion of Immigrants from Caribbean and percentage of population with at least associate's degree education in the United States with a correlation coefficient (R) of -0.418 and weighted average of 39.7%. Similarly, the statistical analysis conducted on geographies consisting of 199,944,026 people shows a poor positive correlation between the proportion of Immigrants from Ghana and percentage of population with at least associate's degree education in the United States with a correlation coefficient (R) of 0.198 and weighted average of 44.8%, a difference of 12.7%.
Associate's Degree Correlation Summary
| Measurement | Immigrants from Caribbean | Immigrants from Ghana |
| Minimum | 14.8% | 12.5% |
| Maximum | 51.5% | 91.7% |
| Range | 36.6% | 79.2% |
| Mean | 36.1% | 43.2% |
| Median | 36.8% | 44.8% |
| Interquartile 25% (IQ1) | 31.3% | 36.9% |
| Interquartile 75% (IQ3) | 41.2% | 48.6% |
| Interquartile Range (IQR) | 9.9% | 11.7% |
| Standard Deviation (Sample) | 7.0% | 13.5% |
| Standard Deviation (Population) | 7.0% | 13.4% |
Similar Demographics by Associate's Degree
Demographics Similar to Immigrants from Caribbean by Associate's Degree
In terms of associate's degree, the demographic groups most similar to Immigrants from Caribbean are Aleut (39.6%, a difference of 0.26%), Immigrants from Belize (39.9%, a difference of 0.34%), Comanche (39.9%, a difference of 0.44%), Immigrants from Cuba (39.5%, a difference of 0.50%), and Haitian (40.0%, a difference of 0.55%).
| Demographics | Rating | Rank | Associate's Degree |
| Immigrants | Nicaragua | 0.1 /100 | #279 | Tragic 40.3% |
| Immigrants | Micronesia | 0.1 /100 | #280 | Tragic 40.2% |
| Immigrants | Portugal | 0.1 /100 | #281 | Tragic 40.1% |
| Bangladeshis | 0.1 /100 | #282 | Tragic 40.0% |
| Haitians | 0.1 /100 | #283 | Tragic 40.0% |
| Comanche | 0.1 /100 | #284 | Tragic 39.9% |
| Immigrants | Belize | 0.1 /100 | #285 | Tragic 39.9% |
| Immigrants | Caribbean | 0.0 /100 | #286 | Tragic 39.7% |
| Aleuts | 0.0 /100 | #287 | Tragic 39.6% |
| Immigrants | Cuba | 0.0 /100 | #288 | Tragic 39.5% |
| Central Americans | 0.0 /100 | #289 | Tragic 39.4% |
| Immigrants | Haiti | 0.0 /100 | #290 | Tragic 39.3% |
| Dominicans | 0.0 /100 | #291 | Tragic 39.3% |
| Blacks/African Americans | 0.0 /100 | #292 | Tragic 39.1% |
| Nepalese | 0.0 /100 | #293 | Tragic 39.0% |
Demographics Similar to Immigrants from Ghana by Associate's Degree
In terms of associate's degree, the demographic groups most similar to Immigrants from Ghana are French Canadian (44.9%, a difference of 0.12%), Immigrants from Middle Africa (44.7%, a difference of 0.25%), Immigrants from Panama (44.7%, a difference of 0.31%), Immigrants from Zaire (45.0%, a difference of 0.35%), and Immigrants from Philippines (45.0%, a difference of 0.36%).
| Demographics | Rating | Rank | Associate's Degree |
| German Russians | 18.9 /100 | #206 | Poor 45.1% |
| Panamanians | 18.4 /100 | #207 | Poor 45.1% |
| Dutch | 17.6 /100 | #208 | Poor 45.0% |
| Immigrants | Costa Rica | 16.7 /100 | #209 | Poor 45.0% |
| Immigrants | Philippines | 16.7 /100 | #210 | Poor 45.0% |
| Immigrants | Zaire | 16.6 /100 | #211 | Poor 45.0% |
| French Canadians | 15.0 /100 | #212 | Poor 44.9% |
| Immigrants | Ghana | 14.2 /100 | #213 | Poor 44.8% |
| Immigrants | Middle Africa | 12.7 /100 | #214 | Poor 44.7% |
| Immigrants | Panama | 12.4 /100 | #215 | Poor 44.7% |
| Immigrants | Nigeria | 11.4 /100 | #216 | Poor 44.6% |
| Immigrants | Immigrants | 10.5 /100 | #217 | Poor 44.5% |
| Spanish | 9.4 /100 | #218 | Tragic 44.4% |
| Whites/Caucasians | 7.5 /100 | #219 | Tragic 44.2% |
| Portuguese | 7.2 /100 | #220 | Tragic 44.1% |