African vs Immigrants from Netherlands 10th Grade
COMPARE
African
Immigrants from Netherlands
10th Grade
10th Grade Comparison
Africans
Immigrants from Netherlands
93.1%
10TH GRADE
4.6/ 100
METRIC RATING
235th/ 347
METRIC RANK
94.9%
10TH GRADE
99.7/ 100
METRIC RATING
67th/ 347
METRIC RANK
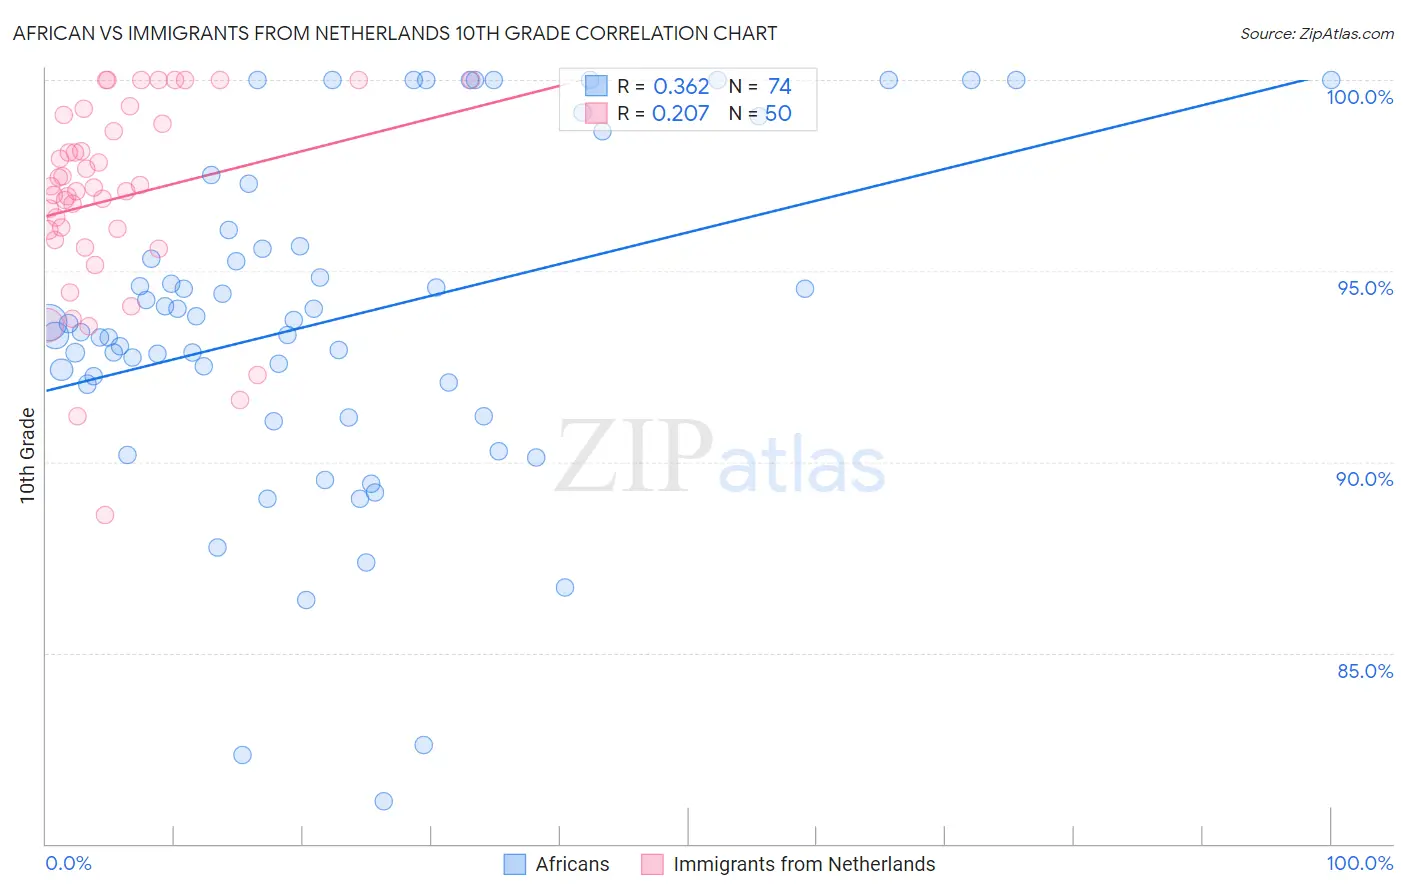
African vs Immigrants from Netherlands 10th Grade Correlation Chart
The statistical analysis conducted on geographies consisting of 470,094,658 people shows a mild positive correlation between the proportion of Africans and percentage of population with at least 10th grade education in the United States with a correlation coefficient (R) of 0.362 and weighted average of 93.1%. Similarly, the statistical analysis conducted on geographies consisting of 237,869,934 people shows a weak positive correlation between the proportion of Immigrants from Netherlands and percentage of population with at least 10th grade education in the United States with a correlation coefficient (R) of 0.207 and weighted average of 94.9%, a difference of 2.0%.
10th Grade Correlation Summary
| Measurement | African | Immigrants from Netherlands |
| Minimum | 81.1% | 88.6% |
| Maximum | 100.0% | 100.0% |
| Range | 18.9% | 11.4% |
| Mean | 93.8% | 96.9% |
| Median | 93.6% | 97.1% |
| Interquartile 25% (IQ1) | 92.0% | 95.8% |
| Interquartile 75% (IQ3) | 96.1% | 98.8% |
| Interquartile Range (IQR) | 4.0% | 3.0% |
| Standard Deviation (Sample) | 4.4% | 2.6% |
| Standard Deviation (Population) | 4.4% | 2.5% |
Similar Demographics by 10th Grade
Demographics Similar to Africans by 10th Grade
In terms of 10th grade, the demographic groups most similar to Africans are Afghan (93.1%, a difference of 0.0%), South American Indian (93.1%, a difference of 0.010%), Bahamian (93.1%, a difference of 0.010%), Comanche (93.1%, a difference of 0.010%), and Subsaharan African (93.1%, a difference of 0.010%).
| Demographics | Rating | Rank | 10th Grade |
| Immigrants | China | 5.9 /100 | #228 | Tragic 93.2% |
| Immigrants | Ethiopia | 5.1 /100 | #229 | Tragic 93.1% |
| Immigrants | Africa | 5.0 /100 | #230 | Tragic 93.1% |
| South American Indians | 4.9 /100 | #231 | Tragic 93.1% |
| Bahamians | 4.9 /100 | #232 | Tragic 93.1% |
| Comanche | 4.9 /100 | #233 | Tragic 93.1% |
| Sub-Saharan Africans | 4.7 /100 | #234 | Tragic 93.1% |
| Africans | 4.6 /100 | #235 | Tragic 93.1% |
| Afghans | 4.5 /100 | #236 | Tragic 93.1% |
| Immigrants | Panama | 4.3 /100 | #237 | Tragic 93.1% |
| Nigerians | 4.2 /100 | #238 | Tragic 93.1% |
| Costa Ricans | 4.2 /100 | #239 | Tragic 93.1% |
| Immigrants | Hong Kong | 4.2 /100 | #240 | Tragic 93.1% |
| Immigrants | Somalia | 2.7 /100 | #241 | Tragic 93.0% |
| Immigrants | Cameroon | 2.6 /100 | #242 | Tragic 93.0% |
Demographics Similar to Immigrants from Netherlands by 10th Grade
In terms of 10th grade, the demographic groups most similar to Immigrants from Netherlands are Immigrants from Australia (94.9%, a difference of 0.0%), Immigrants from Belgium (94.9%, a difference of 0.0%), Immigrants from England (94.9%, a difference of 0.020%), Zimbabwean (94.9%, a difference of 0.030%), and Alaska Native (94.9%, a difference of 0.030%).
| Demographics | Rating | Rank | 10th Grade |
| Cypriots | 99.8 /100 | #60 | Exceptional 95.0% |
| Chippewa | 99.8 /100 | #61 | Exceptional 95.0% |
| Thais | 99.8 /100 | #62 | Exceptional 95.0% |
| Immigrants | Singapore | 99.8 /100 | #63 | Exceptional 95.0% |
| Native Hawaiians | 99.7 /100 | #64 | Exceptional 95.0% |
| Turks | 99.7 /100 | #65 | Exceptional 95.0% |
| Immigrants | Australia | 99.7 /100 | #66 | Exceptional 94.9% |
| Immigrants | Netherlands | 99.7 /100 | #67 | Exceptional 94.9% |
| Immigrants | Belgium | 99.7 /100 | #68 | Exceptional 94.9% |
| Immigrants | England | 99.6 /100 | #69 | Exceptional 94.9% |
| Zimbabweans | 99.6 /100 | #70 | Exceptional 94.9% |
| Alaska Natives | 99.6 /100 | #71 | Exceptional 94.9% |
| Immigrants | Sweden | 99.6 /100 | #72 | Exceptional 94.9% |
| Bhutanese | 99.6 /100 | #73 | Exceptional 94.9% |
| Canadians | 99.6 /100 | #74 | Exceptional 94.9% |