African vs Immigrants from Netherlands Seniors Poverty Over the Age of 65
COMPARE
African
Immigrants from Netherlands
Seniors Poverty Over the Age of 65
Seniors Poverty Over the Age of 65 Comparison
Africans
Immigrants from Netherlands
12.6%
SENIORS POVERTY OVER THE AGE OF 65
0.1/ 100
METRIC RATING
266th/ 347
METRIC RANK
9.9%
SENIORS POVERTY OVER THE AGE OF 65
98.7/ 100
METRIC RATING
66th/ 347
METRIC RANK
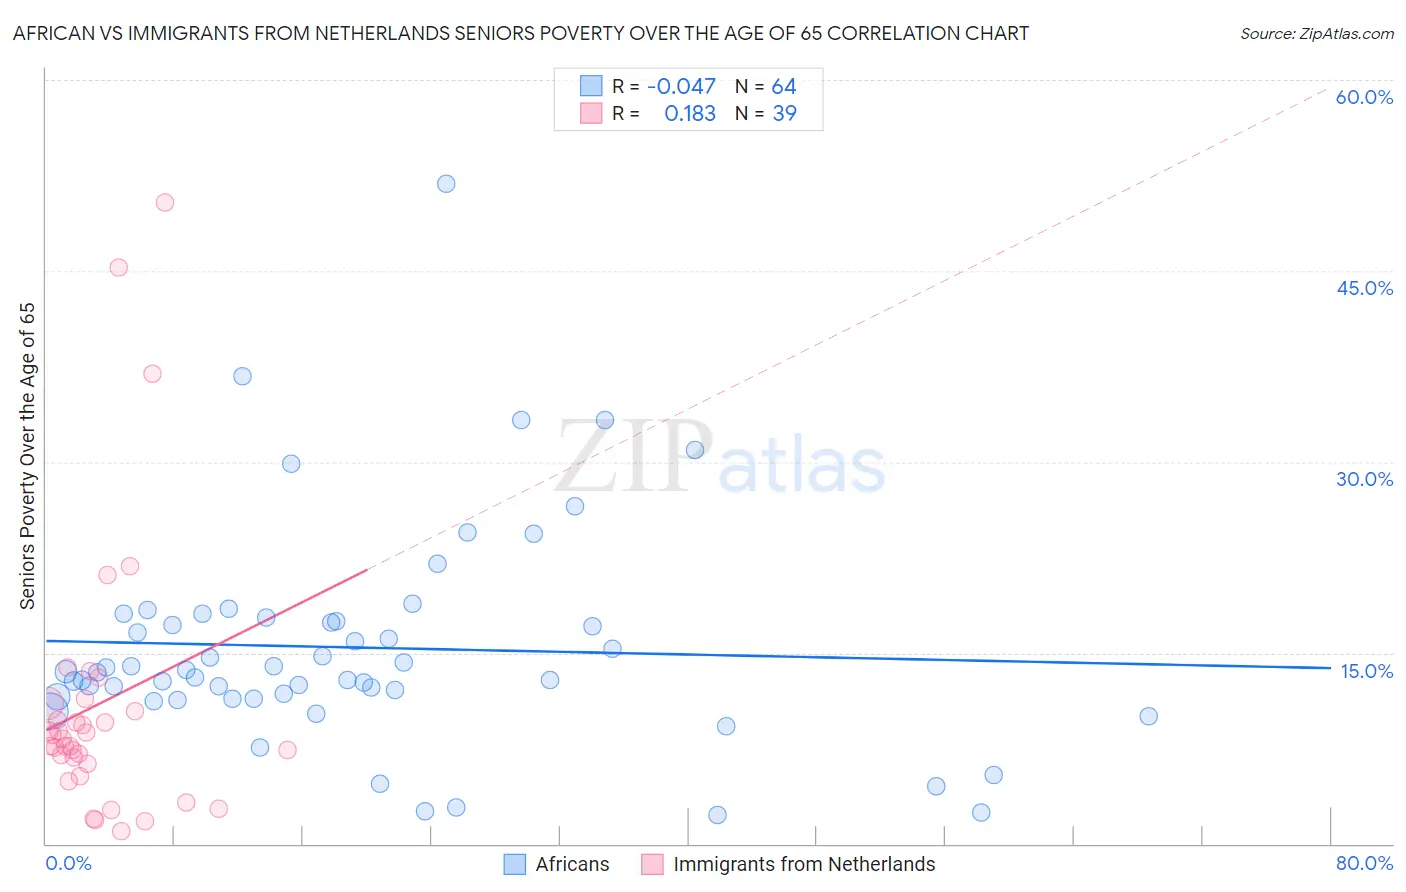
African vs Immigrants from Netherlands Seniors Poverty Over the Age of 65 Correlation Chart
The statistical analysis conducted on geographies consisting of 467,842,102 people shows no correlation between the proportion of Africans and poverty level among seniors over the age of 65 in the United States with a correlation coefficient (R) of -0.047 and weighted average of 12.6%. Similarly, the statistical analysis conducted on geographies consisting of 237,542,922 people shows a poor positive correlation between the proportion of Immigrants from Netherlands and poverty level among seniors over the age of 65 in the United States with a correlation coefficient (R) of 0.183 and weighted average of 9.9%, a difference of 27.3%.
Seniors Poverty Over the Age of 65 Correlation Summary
| Measurement | African | Immigrants from Netherlands |
| Minimum | 2.2% | 1.0% |
| Maximum | 51.9% | 50.3% |
| Range | 49.6% | 49.3% |
| Mean | 15.4% | 11.0% |
| Median | 13.5% | 8.2% |
| Interquartile 25% (IQ1) | 11.5% | 6.3% |
| Interquartile 75% (IQ3) | 17.6% | 11.0% |
| Interquartile Range (IQR) | 6.2% | 4.8% |
| Standard Deviation (Sample) | 8.6% | 10.8% |
| Standard Deviation (Population) | 8.5% | 10.7% |
Similar Demographics by Seniors Poverty Over the Age of 65
Demographics Similar to Africans by Seniors Poverty Over the Age of 65
In terms of seniors poverty over the age of 65, the demographic groups most similar to Africans are Blackfeet (12.6%, a difference of 0.14%), Immigrants from Western Africa (12.6%, a difference of 0.17%), Immigrants from Somalia (12.6%, a difference of 0.24%), Inupiat (12.6%, a difference of 0.26%), and Soviet Union (12.6%, a difference of 0.33%).
| Demographics | Rating | Rank | Seniors Poverty Over the Age of 65 |
| Ghanaians | 0.2 /100 | #259 | Tragic 12.4% |
| South Americans | 0.2 /100 | #260 | Tragic 12.5% |
| Colombians | 0.2 /100 | #261 | Tragic 12.5% |
| Venezuelans | 0.1 /100 | #262 | Tragic 12.5% |
| Soviet Union | 0.1 /100 | #263 | Tragic 12.6% |
| Inupiat | 0.1 /100 | #264 | Tragic 12.6% |
| Immigrants | Western Africa | 0.1 /100 | #265 | Tragic 12.6% |
| Africans | 0.1 /100 | #266 | Tragic 12.6% |
| Blackfeet | 0.1 /100 | #267 | Tragic 12.6% |
| Immigrants | Somalia | 0.1 /100 | #268 | Tragic 12.6% |
| Immigrants | Venezuela | 0.1 /100 | #269 | Tragic 12.7% |
| Immigrants | South America | 0.1 /100 | #270 | Tragic 12.7% |
| Immigrants | Ghana | 0.1 /100 | #271 | Tragic 12.8% |
| Immigrants | Uruguay | 0.1 /100 | #272 | Tragic 12.8% |
| Kiowa | 0.0 /100 | #273 | Tragic 12.8% |
Demographics Similar to Immigrants from Netherlands by Seniors Poverty Over the Age of 65
In terms of seniors poverty over the age of 65, the demographic groups most similar to Immigrants from Netherlands are Pennsylvania German (9.9%, a difference of 0.050%), Immigrants from Austria (9.9%, a difference of 0.10%), Canadian (9.9%, a difference of 0.32%), Immigrants from North America (9.9%, a difference of 0.33%), and Macedonian (9.9%, a difference of 0.38%).
| Demographics | Rating | Rank | Seniors Poverty Over the Age of 65 |
| Immigrants | Canada | 99.0 /100 | #59 | Exceptional 9.8% |
| Celtics | 99.0 /100 | #60 | Exceptional 9.8% |
| Iranians | 98.9 /100 | #61 | Exceptional 9.8% |
| French Canadians | 98.9 /100 | #62 | Exceptional 9.8% |
| Macedonians | 98.8 /100 | #63 | Exceptional 9.9% |
| Immigrants | North America | 98.8 /100 | #64 | Exceptional 9.9% |
| Pennsylvania Germans | 98.7 /100 | #65 | Exceptional 9.9% |
| Immigrants | Netherlands | 98.7 /100 | #66 | Exceptional 9.9% |
| Immigrants | Austria | 98.6 /100 | #67 | Exceptional 9.9% |
| Canadians | 98.5 /100 | #68 | Exceptional 9.9% |
| Australians | 98.4 /100 | #69 | Exceptional 9.9% |
| Samoans | 98.0 /100 | #70 | Exceptional 10.0% |
| Yugoslavians | 97.9 /100 | #71 | Exceptional 10.0% |
| Palestinians | 97.9 /100 | #72 | Exceptional 10.0% |
| Russians | 97.9 /100 | #73 | Exceptional 10.0% |