Vietnamese vs Immigrants from Netherlands 10th Grade
COMPARE
Vietnamese
Immigrants from Netherlands
10th Grade
10th Grade Comparison
Vietnamese
Immigrants from Netherlands
90.9%
10TH GRADE
0.0/ 100
METRIC RATING
310th/ 347
METRIC RANK
94.9%
10TH GRADE
99.7/ 100
METRIC RATING
67th/ 347
METRIC RANK
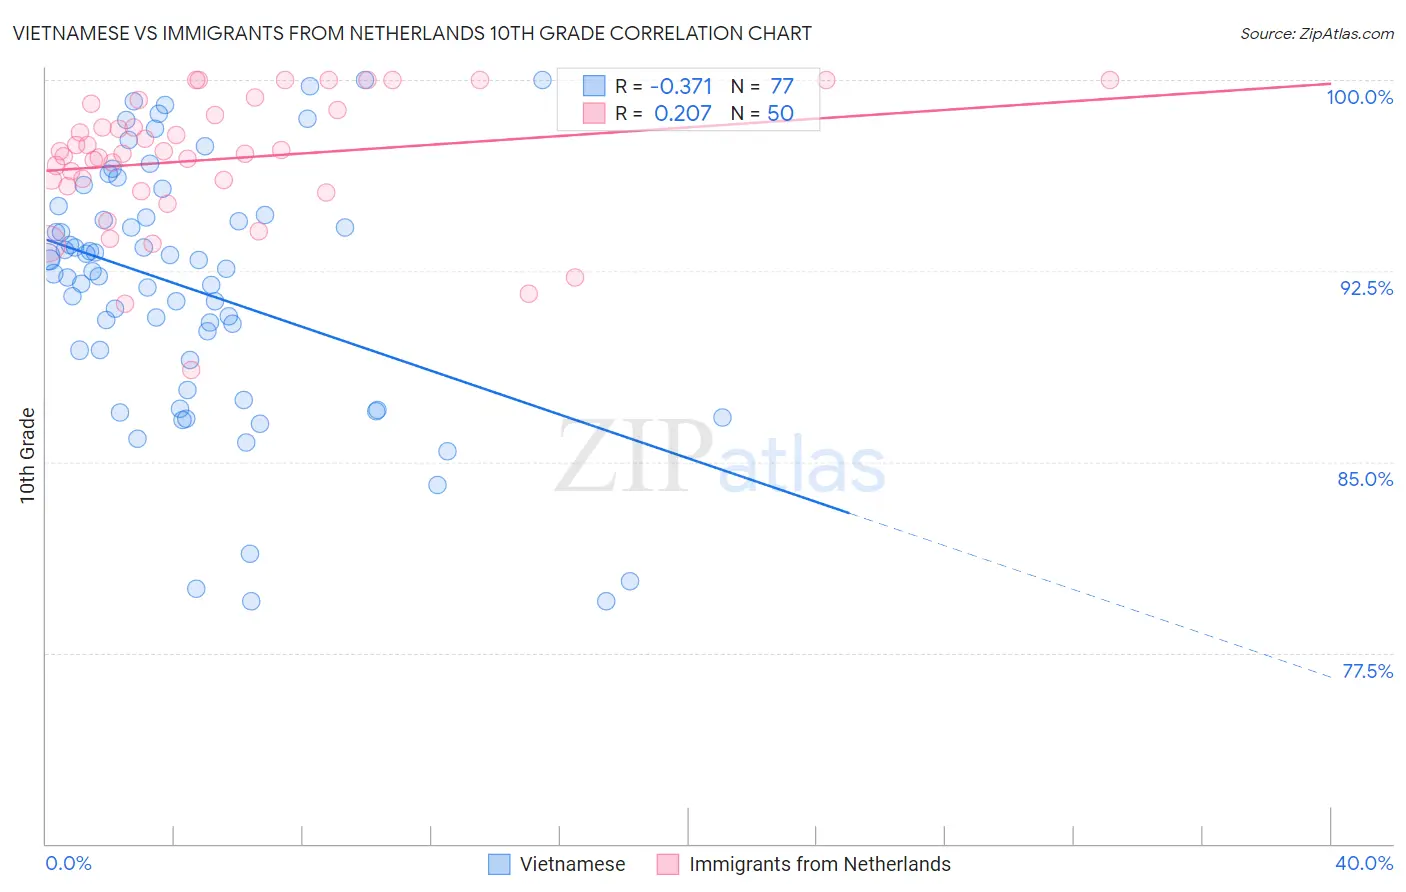
Vietnamese vs Immigrants from Netherlands 10th Grade Correlation Chart
The statistical analysis conducted on geographies consisting of 170,728,240 people shows a mild negative correlation between the proportion of Vietnamese and percentage of population with at least 10th grade education in the United States with a correlation coefficient (R) of -0.371 and weighted average of 90.9%. Similarly, the statistical analysis conducted on geographies consisting of 237,869,934 people shows a weak positive correlation between the proportion of Immigrants from Netherlands and percentage of population with at least 10th grade education in the United States with a correlation coefficient (R) of 0.207 and weighted average of 94.9%, a difference of 4.4%.
10th Grade Correlation Summary
| Measurement | Vietnamese | Immigrants from Netherlands |
| Minimum | 79.5% | 88.6% |
| Maximum | 100.0% | 100.0% |
| Range | 20.5% | 11.4% |
| Mean | 91.8% | 96.9% |
| Median | 92.5% | 97.1% |
| Interquartile 25% (IQ1) | 88.4% | 95.8% |
| Interquartile 75% (IQ3) | 94.6% | 98.8% |
| Interquartile Range (IQR) | 6.2% | 3.0% |
| Standard Deviation (Sample) | 5.0% | 2.6% |
| Standard Deviation (Population) | 4.9% | 2.5% |
Similar Demographics by 10th Grade
Demographics Similar to Vietnamese by 10th Grade
In terms of 10th grade, the demographic groups most similar to Vietnamese are Immigrants from Cambodia (90.9%, a difference of 0.020%), Immigrants (91.0%, a difference of 0.040%), Immigrants from Bangladesh (91.0%, a difference of 0.080%), Immigrants from Fiji (91.0%, a difference of 0.090%), and Yaqui (91.1%, a difference of 0.15%).
| Demographics | Rating | Rank | 10th Grade |
| Immigrants | Vietnam | 0.0 /100 | #303 | Tragic 91.2% |
| Pima | 0.0 /100 | #304 | Tragic 91.2% |
| Immigrants | Dominica | 0.0 /100 | #305 | Tragic 91.1% |
| Yaqui | 0.0 /100 | #306 | Tragic 91.1% |
| Immigrants | Fiji | 0.0 /100 | #307 | Tragic 91.0% |
| Immigrants | Bangladesh | 0.0 /100 | #308 | Tragic 91.0% |
| Immigrants | Immigrants | 0.0 /100 | #309 | Tragic 91.0% |
| Vietnamese | 0.0 /100 | #310 | Tragic 90.9% |
| Immigrants | Cambodia | 0.0 /100 | #311 | Tragic 90.9% |
| Immigrants | Portugal | 0.0 /100 | #312 | Tragic 90.8% |
| Cape Verdeans | 0.0 /100 | #313 | Tragic 90.8% |
| Nepalese | 0.0 /100 | #314 | Tragic 90.7% |
| Immigrants | Caribbean | 0.0 /100 | #315 | Tragic 90.6% |
| Ecuadorians | 0.0 /100 | #316 | Tragic 90.6% |
| Immigrants | Ecuador | 0.0 /100 | #317 | Tragic 90.4% |
Demographics Similar to Immigrants from Netherlands by 10th Grade
In terms of 10th grade, the demographic groups most similar to Immigrants from Netherlands are Immigrants from Australia (94.9%, a difference of 0.0%), Immigrants from Belgium (94.9%, a difference of 0.0%), Immigrants from England (94.9%, a difference of 0.020%), Zimbabwean (94.9%, a difference of 0.030%), and Alaska Native (94.9%, a difference of 0.030%).
| Demographics | Rating | Rank | 10th Grade |
| Cypriots | 99.8 /100 | #60 | Exceptional 95.0% |
| Chippewa | 99.8 /100 | #61 | Exceptional 95.0% |
| Thais | 99.8 /100 | #62 | Exceptional 95.0% |
| Immigrants | Singapore | 99.8 /100 | #63 | Exceptional 95.0% |
| Native Hawaiians | 99.7 /100 | #64 | Exceptional 95.0% |
| Turks | 99.7 /100 | #65 | Exceptional 95.0% |
| Immigrants | Australia | 99.7 /100 | #66 | Exceptional 94.9% |
| Immigrants | Netherlands | 99.7 /100 | #67 | Exceptional 94.9% |
| Immigrants | Belgium | 99.7 /100 | #68 | Exceptional 94.9% |
| Immigrants | England | 99.6 /100 | #69 | Exceptional 94.9% |
| Zimbabweans | 99.6 /100 | #70 | Exceptional 94.9% |
| Alaska Natives | 99.6 /100 | #71 | Exceptional 94.9% |
| Immigrants | Sweden | 99.6 /100 | #72 | Exceptional 94.9% |
| Bhutanese | 99.6 /100 | #73 | Exceptional 94.9% |
| Canadians | 99.6 /100 | #74 | Exceptional 94.9% |