African vs Immigrants from Bahamas 10th Grade
COMPARE
African
Immigrants from Bahamas
10th Grade
10th Grade Comparison
Africans
Immigrants from Bahamas
93.1%
10TH GRADE
4.6/ 100
METRIC RATING
235th/ 347
METRIC RANK
93.4%
10TH GRADE
15.2/ 100
METRIC RATING
214th/ 347
METRIC RANK
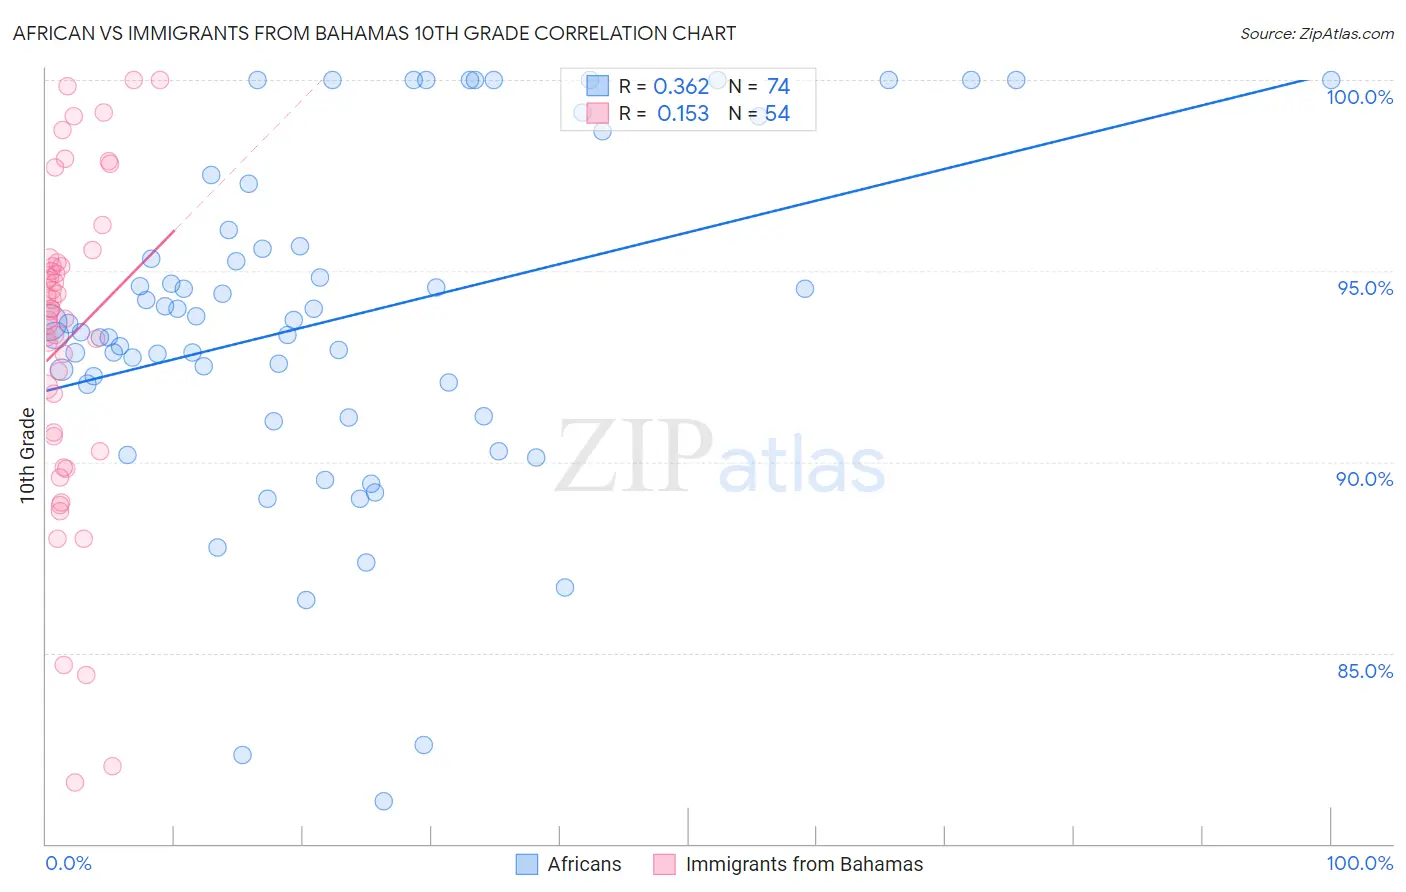
African vs Immigrants from Bahamas 10th Grade Correlation Chart
The statistical analysis conducted on geographies consisting of 470,094,658 people shows a mild positive correlation between the proportion of Africans and percentage of population with at least 10th grade education in the United States with a correlation coefficient (R) of 0.362 and weighted average of 93.1%. Similarly, the statistical analysis conducted on geographies consisting of 104,668,036 people shows a poor positive correlation between the proportion of Immigrants from Bahamas and percentage of population with at least 10th grade education in the United States with a correlation coefficient (R) of 0.153 and weighted average of 93.4%, a difference of 0.30%.
10th Grade Correlation Summary
| Measurement | African | Immigrants from Bahamas |
| Minimum | 81.1% | 81.6% |
| Maximum | 100.0% | 100.0% |
| Range | 18.9% | 18.4% |
| Mean | 93.8% | 93.2% |
| Median | 93.6% | 94.0% |
| Interquartile 25% (IQ1) | 92.0% | 90.7% |
| Interquartile 75% (IQ3) | 96.1% | 95.2% |
| Interquartile Range (IQR) | 4.0% | 4.5% |
| Standard Deviation (Sample) | 4.4% | 4.2% |
| Standard Deviation (Population) | 4.4% | 4.2% |
Similar Demographics by 10th Grade
Demographics Similar to Africans by 10th Grade
In terms of 10th grade, the demographic groups most similar to Africans are Afghan (93.1%, a difference of 0.0%), South American Indian (93.1%, a difference of 0.010%), Bahamian (93.1%, a difference of 0.010%), Comanche (93.1%, a difference of 0.010%), and Subsaharan African (93.1%, a difference of 0.010%).
| Demographics | Rating | Rank | 10th Grade |
| Immigrants | China | 5.9 /100 | #228 | Tragic 93.2% |
| Immigrants | Ethiopia | 5.1 /100 | #229 | Tragic 93.1% |
| Immigrants | Africa | 5.0 /100 | #230 | Tragic 93.1% |
| South American Indians | 4.9 /100 | #231 | Tragic 93.1% |
| Bahamians | 4.9 /100 | #232 | Tragic 93.1% |
| Comanche | 4.9 /100 | #233 | Tragic 93.1% |
| Sub-Saharan Africans | 4.7 /100 | #234 | Tragic 93.1% |
| Africans | 4.6 /100 | #235 | Tragic 93.1% |
| Afghans | 4.5 /100 | #236 | Tragic 93.1% |
| Immigrants | Panama | 4.3 /100 | #237 | Tragic 93.1% |
| Nigerians | 4.2 /100 | #238 | Tragic 93.1% |
| Costa Ricans | 4.2 /100 | #239 | Tragic 93.1% |
| Immigrants | Hong Kong | 4.2 /100 | #240 | Tragic 93.1% |
| Immigrants | Somalia | 2.7 /100 | #241 | Tragic 93.0% |
| Immigrants | Cameroon | 2.6 /100 | #242 | Tragic 93.0% |
Demographics Similar to Immigrants from Bahamas by 10th Grade
In terms of 10th grade, the demographic groups most similar to Immigrants from Bahamas are Immigrants from Oceania (93.4%, a difference of 0.0%), Immigrants from Asia (93.4%, a difference of 0.010%), Immigrants from Eastern Africa (93.4%, a difference of 0.010%), Immigrants from Zaire (93.4%, a difference of 0.020%), and Cajun (93.4%, a difference of 0.030%).
| Demographics | Rating | Rank | 10th Grade |
| Samoans | 19.5 /100 | #207 | Poor 93.4% |
| Immigrants | Syria | 19.4 /100 | #208 | Poor 93.4% |
| Immigrants | Chile | 18.8 /100 | #209 | Poor 93.4% |
| Indians (Asian) | 17.6 /100 | #210 | Poor 93.4% |
| Cajuns | 16.9 /100 | #211 | Poor 93.4% |
| Immigrants | Zaire | 16.7 /100 | #212 | Poor 93.4% |
| Immigrants | Asia | 15.7 /100 | #213 | Poor 93.4% |
| Immigrants | Bahamas | 15.2 /100 | #214 | Poor 93.4% |
| Immigrants | Oceania | 15.1 /100 | #215 | Poor 93.4% |
| Immigrants | Eastern Africa | 14.7 /100 | #216 | Poor 93.4% |
| Portuguese | 12.1 /100 | #217 | Poor 93.3% |
| Immigrants | Liberia | 10.2 /100 | #218 | Poor 93.3% |
| Seminole | 10.2 /100 | #219 | Poor 93.3% |
| Tongans | 9.5 /100 | #220 | Tragic 93.3% |
| Immigrants | Southern Europe | 8.9 /100 | #221 | Tragic 93.2% |