African vs Estonian 10th Grade
COMPARE
African
Estonian
10th Grade
10th Grade Comparison
Africans
Estonians
93.1%
10TH GRADE
4.6/ 100
METRIC RATING
235th/ 347
METRIC RANK
95.3%
10TH GRADE
99.9/ 100
METRIC RATING
35th/ 347
METRIC RANK
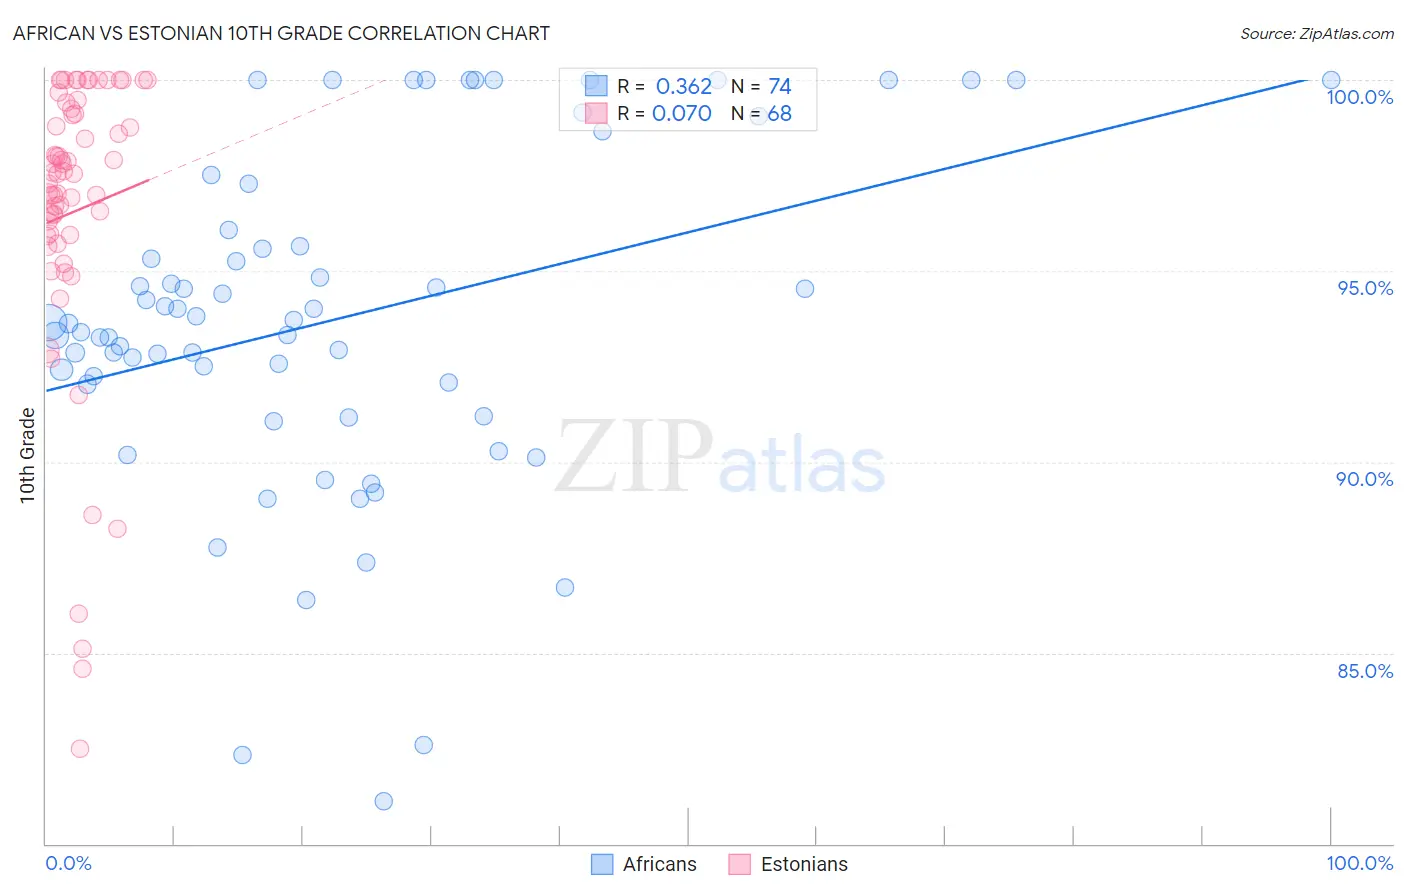
African vs Estonian 10th Grade Correlation Chart
The statistical analysis conducted on geographies consisting of 470,094,658 people shows a mild positive correlation between the proportion of Africans and percentage of population with at least 10th grade education in the United States with a correlation coefficient (R) of 0.362 and weighted average of 93.1%. Similarly, the statistical analysis conducted on geographies consisting of 123,528,404 people shows a slight positive correlation between the proportion of Estonians and percentage of population with at least 10th grade education in the United States with a correlation coefficient (R) of 0.070 and weighted average of 95.3%, a difference of 2.4%.
10th Grade Correlation Summary
| Measurement | African | Estonian |
| Minimum | 81.1% | 82.5% |
| Maximum | 100.0% | 100.0% |
| Range | 18.9% | 17.5% |
| Mean | 93.8% | 96.5% |
| Median | 93.6% | 97.5% |
| Interquartile 25% (IQ1) | 92.0% | 95.9% |
| Interquartile 75% (IQ3) | 96.1% | 99.2% |
| Interquartile Range (IQR) | 4.0% | 3.3% |
| Standard Deviation (Sample) | 4.4% | 3.9% |
| Standard Deviation (Population) | 4.4% | 3.9% |
Similar Demographics by 10th Grade
Demographics Similar to Africans by 10th Grade
In terms of 10th grade, the demographic groups most similar to Africans are Afghan (93.1%, a difference of 0.0%), South American Indian (93.1%, a difference of 0.010%), Bahamian (93.1%, a difference of 0.010%), Comanche (93.1%, a difference of 0.010%), and Subsaharan African (93.1%, a difference of 0.010%).
| Demographics | Rating | Rank | 10th Grade |
| Immigrants | China | 5.9 /100 | #228 | Tragic 93.2% |
| Immigrants | Ethiopia | 5.1 /100 | #229 | Tragic 93.1% |
| Immigrants | Africa | 5.0 /100 | #230 | Tragic 93.1% |
| South American Indians | 4.9 /100 | #231 | Tragic 93.1% |
| Bahamians | 4.9 /100 | #232 | Tragic 93.1% |
| Comanche | 4.9 /100 | #233 | Tragic 93.1% |
| Sub-Saharan Africans | 4.7 /100 | #234 | Tragic 93.1% |
| Africans | 4.6 /100 | #235 | Tragic 93.1% |
| Afghans | 4.5 /100 | #236 | Tragic 93.1% |
| Immigrants | Panama | 4.3 /100 | #237 | Tragic 93.1% |
| Nigerians | 4.2 /100 | #238 | Tragic 93.1% |
| Costa Ricans | 4.2 /100 | #239 | Tragic 93.1% |
| Immigrants | Hong Kong | 4.2 /100 | #240 | Tragic 93.1% |
| Immigrants | Somalia | 2.7 /100 | #241 | Tragic 93.0% |
| Immigrants | Cameroon | 2.6 /100 | #242 | Tragic 93.0% |
Demographics Similar to Estonians by 10th Grade
In terms of 10th grade, the demographic groups most similar to Estonians are British (95.3%, a difference of 0.010%), Immigrants from India (95.3%, a difference of 0.010%), Iranian (95.3%, a difference of 0.020%), Hungarian (95.3%, a difference of 0.020%), and French (95.3%, a difference of 0.020%).
| Demographics | Rating | Rank | 10th Grade |
| Luxembourgers | 100.0 /100 | #28 | Exceptional 95.4% |
| Bulgarians | 100.0 /100 | #29 | Exceptional 95.4% |
| Belgians | 100.0 /100 | #30 | Exceptional 95.4% |
| Iranians | 100.0 /100 | #31 | Exceptional 95.3% |
| Hungarians | 100.0 /100 | #32 | Exceptional 95.3% |
| French | 100.0 /100 | #33 | Exceptional 95.3% |
| British | 99.9 /100 | #34 | Exceptional 95.3% |
| Estonians | 99.9 /100 | #35 | Exceptional 95.3% |
| Immigrants | India | 99.9 /100 | #36 | Exceptional 95.3% |
| French Canadians | 99.9 /100 | #37 | Exceptional 95.3% |
| Northern Europeans | 99.9 /100 | #38 | Exceptional 95.3% |
| Immigrants | Scotland | 99.9 /100 | #39 | Exceptional 95.2% |
| Scotch-Irish | 99.9 /100 | #40 | Exceptional 95.2% |
| Russians | 99.9 /100 | #41 | Exceptional 95.2% |
| Slavs | 99.9 /100 | #42 | Exceptional 95.2% |