African vs Immigrants from Netherlands Nursery School
COMPARE
African
Immigrants from Netherlands
Nursery School
Nursery School Comparison
Africans
Immigrants from Netherlands
97.9%
NURSERY SCHOOL
15.4/ 100
METRIC RATING
207th/ 347
METRIC RANK
98.4%
NURSERY SCHOOL
99.4/ 100
METRIC RATING
74th/ 347
METRIC RANK
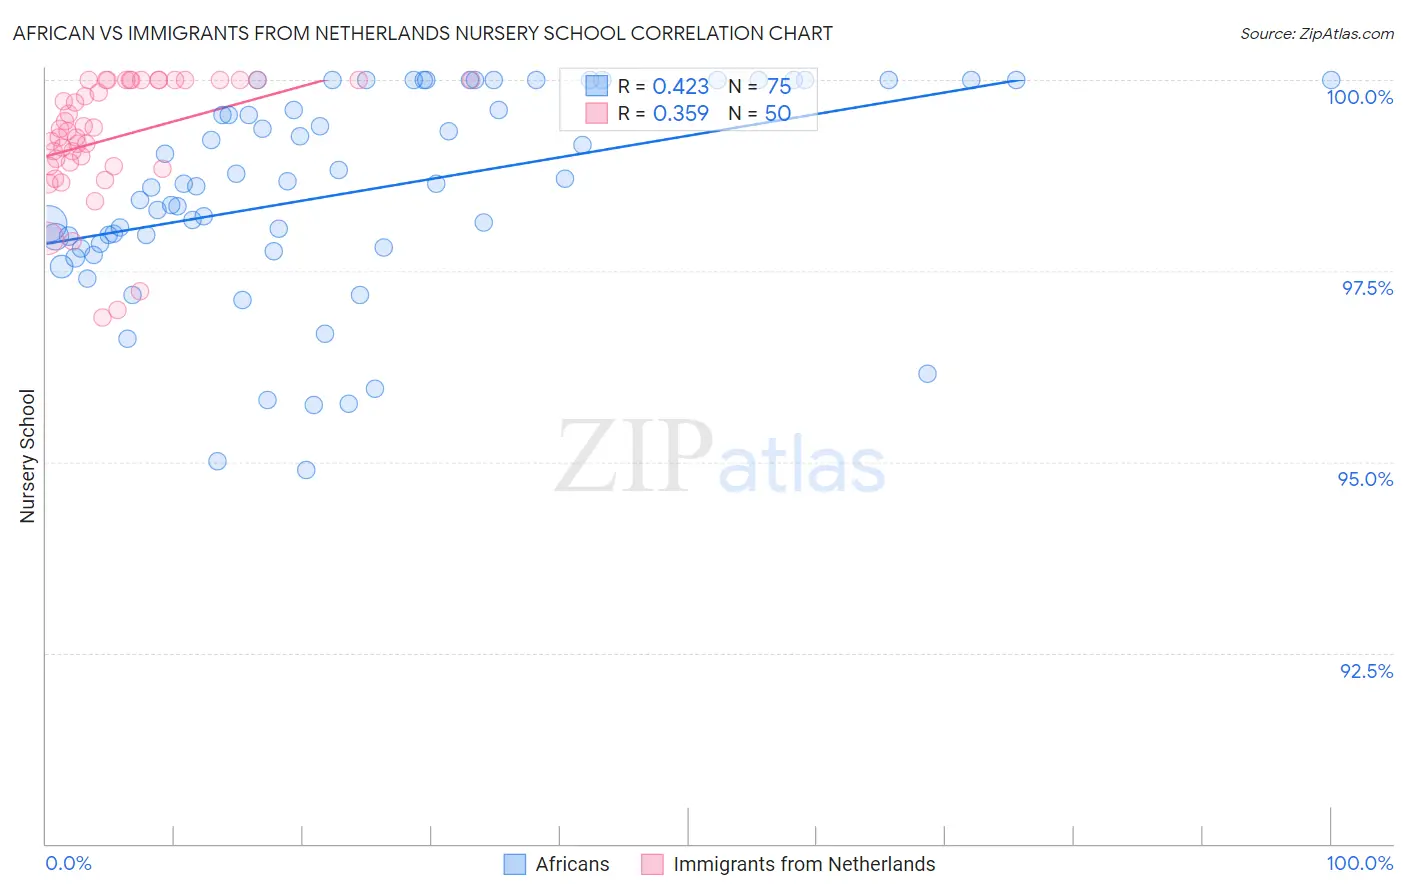
African vs Immigrants from Netherlands Nursery School Correlation Chart
The statistical analysis conducted on geographies consisting of 470,094,148 people shows a moderate positive correlation between the proportion of Africans and percentage of population with at least nursery school education in the United States with a correlation coefficient (R) of 0.423 and weighted average of 97.9%. Similarly, the statistical analysis conducted on geographies consisting of 237,869,934 people shows a mild positive correlation between the proportion of Immigrants from Netherlands and percentage of population with at least nursery school education in the United States with a correlation coefficient (R) of 0.359 and weighted average of 98.4%, a difference of 0.51%.
Nursery School Correlation Summary
| Measurement | African | Immigrants from Netherlands |
| Minimum | 94.9% | 96.9% |
| Maximum | 100.0% | 100.0% |
| Range | 5.1% | 3.1% |
| Mean | 98.5% | 99.2% |
| Median | 98.6% | 99.3% |
| Interquartile 25% (IQ1) | 97.8% | 98.9% |
| Interquartile 75% (IQ3) | 100.0% | 100.0% |
| Interquartile Range (IQR) | 2.2% | 1.1% |
| Standard Deviation (Sample) | 1.3% | 0.80% |
| Standard Deviation (Population) | 1.3% | 0.79% |
Similar Demographics by Nursery School
Demographics Similar to Africans by Nursery School
In terms of nursery school, the demographic groups most similar to Africans are Immigrants from Uganda (97.9%, a difference of 0.010%), Immigrants from Southern Europe (97.9%, a difference of 0.010%), Immigrants from Chile (97.9%, a difference of 0.010%), Immigrants from Albania (97.9%, a difference of 0.010%), and Immigrants from Ukraine (97.9%, a difference of 0.020%).
| Demographics | Rating | Rank | Nursery School |
| Tohono O'odham | 22.2 /100 | #200 | Fair 97.9% |
| Immigrants | Lebanon | 21.2 /100 | #201 | Fair 97.9% |
| Immigrants | Ukraine | 19.9 /100 | #202 | Poor 97.9% |
| Immigrants | Uganda | 18.0 /100 | #203 | Poor 97.9% |
| Immigrants | Southern Europe | 17.4 /100 | #204 | Poor 97.9% |
| Immigrants | Chile | 17.3 /100 | #205 | Poor 97.9% |
| Immigrants | Albania | 16.4 /100 | #206 | Poor 97.9% |
| Africans | 15.4 /100 | #207 | Poor 97.9% |
| Immigrants | Northern Africa | 11.7 /100 | #208 | Poor 97.8% |
| Costa Ricans | 11.3 /100 | #209 | Poor 97.8% |
| Immigrants | Oceania | 10.2 /100 | #210 | Poor 97.8% |
| Laotians | 9.8 /100 | #211 | Tragic 97.8% |
| Immigrants | Bahamas | 8.6 /100 | #212 | Tragic 97.8% |
| Moroccans | 8.3 /100 | #213 | Tragic 97.8% |
| South American Indians | 8.0 /100 | #214 | Tragic 97.8% |
Demographics Similar to Immigrants from Netherlands by Nursery School
In terms of nursery school, the demographic groups most similar to Immigrants from Netherlands are Cajun (98.4%, a difference of 0.0%), Cherokee (98.3%, a difference of 0.010%), Immigrants from England (98.3%, a difference of 0.010%), Immigrants from Lithuania (98.3%, a difference of 0.010%), and Delaware (98.3%, a difference of 0.010%).
| Demographics | Rating | Rank | Nursery School |
| Immigrants | Northern Europe | 99.6 /100 | #67 | Exceptional 98.4% |
| Russians | 99.6 /100 | #68 | Exceptional 98.4% |
| Immigrants | Austria | 99.6 /100 | #69 | Exceptional 98.4% |
| Cheyenne | 99.6 /100 | #70 | Exceptional 98.4% |
| Serbians | 99.6 /100 | #71 | Exceptional 98.4% |
| Chickasaw | 99.6 /100 | #72 | Exceptional 98.4% |
| Cajuns | 99.4 /100 | #73 | Exceptional 98.4% |
| Immigrants | Netherlands | 99.4 /100 | #74 | Exceptional 98.4% |
| Cherokee | 99.3 /100 | #75 | Exceptional 98.3% |
| Immigrants | England | 99.3 /100 | #76 | Exceptional 98.3% |
| Immigrants | Lithuania | 99.3 /100 | #77 | Exceptional 98.3% |
| Delaware | 99.3 /100 | #78 | Exceptional 98.3% |
| Immigrants | Belgium | 99.3 /100 | #79 | Exceptional 98.3% |
| Shoshone | 99.3 /100 | #80 | Exceptional 98.3% |
| Icelanders | 99.2 /100 | #81 | Exceptional 98.3% |