African vs Hmong 10th Grade

COMPARE

African
Race
Ancestry
AfghanAfricanAlaska NativeAlaskan AthabascanAlbanianAleutAlsatianAmericanApacheArabArapahoArgentineanArmenianAssyrian/Chaldean/SyriacAustralianAustrianBahamianBangladeshiBarbadianBasqueBelgianBelizeanBermudanBhutaneseBlackfeetBolivianBrazilianBritishBritish West IndianBulgarianBurmeseCajunCambodianCanadianCape VerdeanCarpatho RusynCelticCentral AmericanCentral American IndianCherokeeCheyenneChickasawChileanChineseChippewaChoctawColombianColvilleComancheCosta RicanCreeCreekCroatianCrowCubanCypriotCzechCzechoslovakianDanishDelawareDominicanDutchDutch West IndianEastern EuropeanEcuadorianEgyptianEnglishEstonianEthiopianEuropeanFijianFilipinoFinnishFrenchFrench American IndianFrench CanadianGermanGerman RussianGhanaianGreekGuamanian/ChamorroGuatemalanGuyaneseHaitianHonduranHopiHoumaHungarianIcelanderIndian (Asian)IndonesianInupiatIranianIraqiIrishIroquoisIsraeliItalianJamaicanJapaneseJordanianKenyanKiowaKoreanLaotianLatvianLebaneseLiberianLithuanianLumbeeLuxembourgerMacedonianMalaysianMalteseMarshalleseMenomineeMexicanMexican American IndianMongolianMoroccanNative HawaiianNavajoNepaleseNew ZealanderNicaraguanNigerianNorthern EuropeanNorwegianOkinawanOsageOttawaPaiutePakistaniPalestinianPanamanianParaguayanPennsylvania GermanPeruvianPimaPolishPortuguesePotawatomiPuebloPuerto RicanPuget Sound SalishRomanianRussianSalvadoranSamoanScandinavianScotch-IrishScottishSeminoleSenegaleseSerbianShoshoneSierra LeoneanSiouxSlavicSlovakSloveneSomaliSouth AfricanSouth AmericanSouth American IndianSoviet UnionSpaniardSpanishSpanish AmericanSpanish American IndianSri LankanSubsaharan AfricanSudaneseSwedishSwissSyrianTaiwaneseThaiTlingit-HaidaTohono O'OdhamTonganTrinidadian and TobagonianTsimshianTurkishU.S. Virgin IslanderUgandanUkrainianUruguayanUteVenezuelanVietnameseWelshWest IndianYakamaYaquiYugoslavianYumanYup'ikZimbabwean
Immigration
NonimmigrantsImmigrantsAfghanistanAfricaAlbaniaArgentinaArmeniaAsiaAustraliaAustriaBahamasBangladeshBarbadosBelarusBelgiumBelizeBoliviaBosnia and HerzegovinaBrazilBulgariaBurma/MyanmarCabo VerdeCambodiaCameroonCanadaCaribbeanCentral AmericaChileChinaColombiaCongoCosta RicaCroatiaCubaCzechoslovakiaDenmarkDominicaDominican RepublicEastern AfricaEastern AsiaEastern EuropeEcuadorEgyptEl SalvadorEnglandEritreaEthiopiaEuropeFijiFranceGermanyGhanaGreeceGrenadaGuatemalaGuyanaHaitiHondurasHong KongHungaryIndiaIndonesiaIranIraqIrelandIsraelItalyJamaicaJapanJordanKazakhstanKenyaKoreaKuwaitLaosLatin AmericaLatviaLebanonLiberiaLithuaniaMalaysiaMexicoMicronesiaMiddle AfricaMoldovaMoroccoNepalNetherlandsNicaraguaNigeriaNorth AmericaNorth MacedoniaNorthern AfricaNorthern EuropeNorwayOceaniaPakistanPanamaPeruPhilippinesPolandPortugalRomaniaRussiaSaudi ArabiaScotlandSenegalSerbiaSierra LeoneSingaporeSomaliaSouth AfricaSouth AmericaSouth Central AsiaSouth Eastern AsiaSouthern EuropeSpainSri LankaSt. Vincent and the GrenadinesSudanSwedenSwitzerlandSyriaTaiwanThailandTrinidad and TobagoTurkeyUgandaUkraineUruguayUzbekistanVenezuelaVietnamWest IndiesWestern AfricaWestern AsiaWestern EuropeYemenZaireZimbabweAzores
Hmong
Race
Ancestry
AfghanAlaska NativeAlaskan AthabascanAlbanianAleutAlsatianAmericanApacheArabArapahoArgentineanArmenianAssyrian/Chaldean/SyriacAustralianAustrianBahamianBangladeshiBarbadianBasqueBelgianBelizeanBermudanBhutaneseBlackfeetBolivianBrazilianBritishBritish West IndianBulgarianBurmeseCajunCambodianCanadianCape VerdeanCarpatho RusynCelticCentral AmericanCentral American IndianCherokeeCheyenneChickasawChileanChineseChippewaChoctawColombianColvilleComancheCosta RicanCreeCreekCroatianCrowCubanCypriotCzechCzechoslovakianDanishDelawareDominicanDutchDutch West IndianEastern EuropeanEcuadorianEgyptianEnglishEstonianEthiopianEuropeanFijianFilipinoFinnishFrenchFrench American IndianFrench CanadianGermanGerman RussianGhanaianGreekGuamanian/ChamorroGuatemalanGuyaneseHaitianHmongHonduranHopiHoumaHungarianIcelanderIndian (Asian)IndonesianInupiatIranianIraqiIrishIroquoisIsraeliItalianJamaicanJapaneseJordanianKenyanKiowaKoreanLaotianLatvianLebaneseLiberianLithuanianLumbeeLuxembourgerMacedonianMalaysianMalteseMarshalleseMenomineeMexicanMexican American IndianMongolianMoroccanNative HawaiianNavajoNepaleseNew ZealanderNicaraguanNigerianNorthern EuropeanNorwegianOkinawanOsageOttawaPaiutePakistaniPalestinianPanamanianParaguayanPennsylvania GermanPeruvianPimaPolishPortuguesePotawatomiPuebloPuerto RicanPuget Sound SalishRomanianRussianSalvadoranSamoanScandinavianScotch-IrishScottishSeminoleSenegaleseSerbianShoshoneSierra LeoneanSiouxSlavicSlovakSloveneSomaliSouth AfricanSouth AmericanSouth American IndianSoviet UnionSpaniardSpanishSpanish AmericanSpanish American IndianSri LankanSubsaharan AfricanSudaneseSwedishSwissSyrianTaiwaneseThaiTlingit-HaidaTohono O'OdhamTonganTrinidadian and TobagonianTsimshianTurkishU.S. Virgin IslanderUgandanUkrainianUruguayanUteVenezuelanVietnameseWelshWest IndianYakamaYaquiYugoslavianYumanYup'ikZimbabwean
Immigration
NonimmigrantsImmigrantsAfghanistanAfricaAlbaniaArgentinaArmeniaAsiaAustraliaAustriaBahamasBangladeshBarbadosBelarusBelgiumBelizeBoliviaBosnia and HerzegovinaBrazilBulgariaBurma/MyanmarCabo VerdeCambodiaCameroonCanadaCaribbeanCentral AmericaChileChinaColombiaCongoCosta RicaCroatiaCubaCzechoslovakiaDenmarkDominicaDominican RepublicEastern AfricaEastern AsiaEastern EuropeEcuadorEgyptEl SalvadorEnglandEritreaEthiopiaEuropeFijiFranceGermanyGhanaGreeceGrenadaGuatemalaGuyanaHaitiHondurasHong KongHungaryIndiaIndonesiaIranIraqIrelandIsraelItalyJamaicaJapanJordanKazakhstanKenyaKoreaKuwaitLaosLatin AmericaLatviaLebanonLiberiaLithuaniaMalaysiaMexicoMicronesiaMiddle AfricaMoldovaMoroccoNepalNetherlandsNicaraguaNigeriaNorth AmericaNorth MacedoniaNorthern AfricaNorthern EuropeNorwayOceaniaPakistanPanamaPeruPhilippinesPolandPortugalRomaniaRussiaSaudi ArabiaScotlandSenegalSerbiaSierra LeoneSingaporeSomaliaSouth AfricaSouth AmericaSouth Central AsiaSouth Eastern AsiaSouthern EuropeSpainSri LankaSt. Vincent and the GrenadinesSudanSwedenSwitzerlandSyriaTaiwanThailandTrinidad and TobagoTurkeyUgandaUkraineUruguayUzbekistanVenezuelaVietnamWest IndiesWestern AfricaWestern AsiaWestern EuropeYemenZaireZimbabweAzores
10th Grade
Income
Poverty
Unemployment
Labor Participation
Family Structure
Vehicle Availability
Education Level
Disability

10th Grade Comparison

Africans

Hmong

Tragic
Excellent
93.1%
10TH GRADE
4.6/ 100
METRIC RATING
235th/ 347
METRIC RANK
94.1%
10TH GRADE
86.6/ 100
METRIC RATING
141st/ 347
METRIC RANK

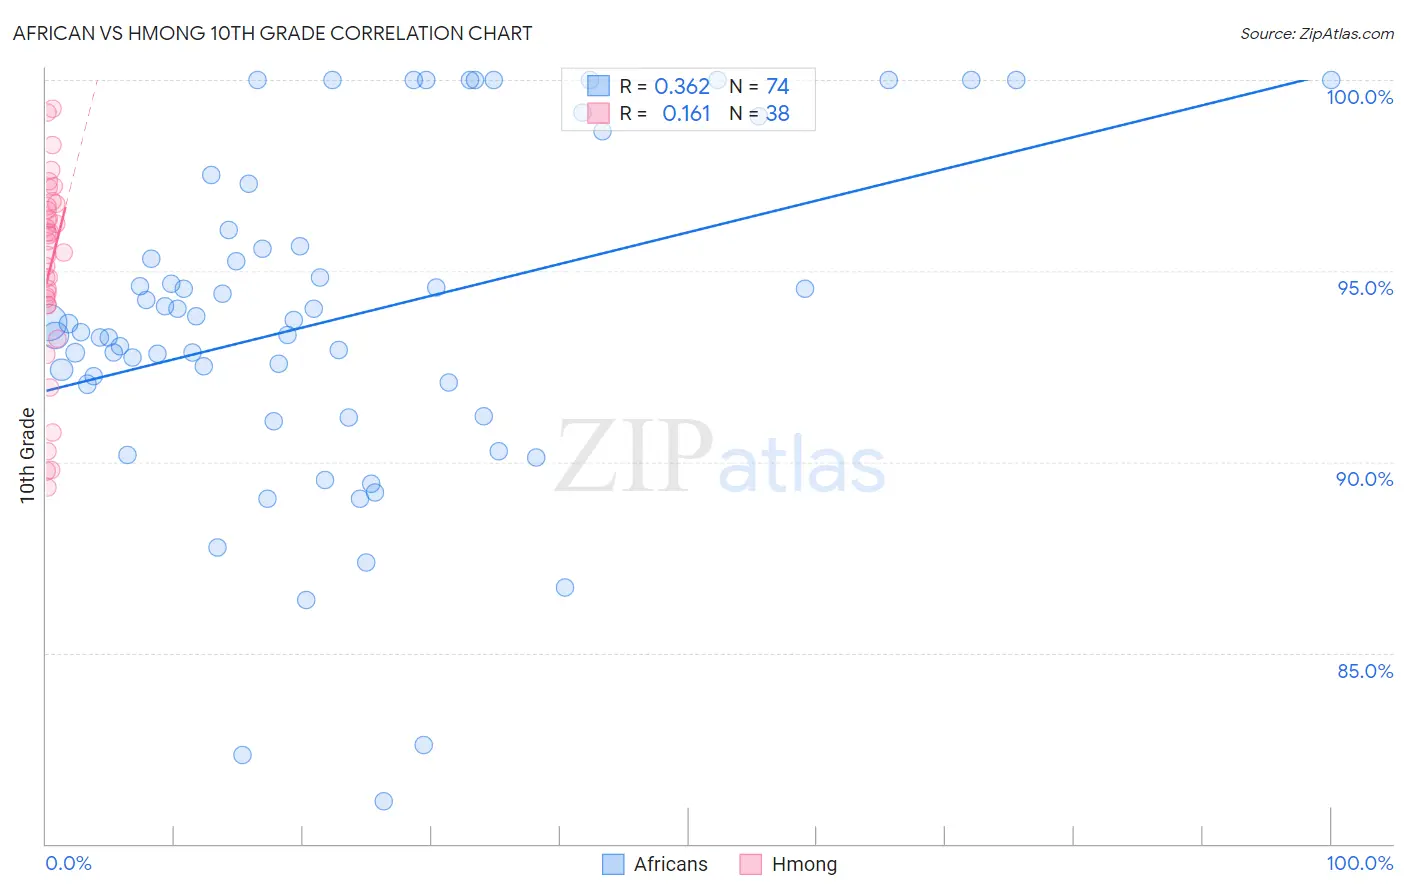
African vs Hmong 10th Grade Correlation Chart

The statistical analysis conducted on geographies consisting of 470,094,658 people shows a mild positive correlation between the proportion of Africans and percentage of population with at least 10th grade education in the United States with a correlation coefficient (R) of 0.362 and weighted average of 93.1%. Similarly, the statistical analysis conducted on geographies consisting of 24,672,093 people shows a poor positive correlation between the proportion of Hmong and percentage of population with at least 10th grade education in the United States with a correlation coefficient (R) of 0.161 and weighted average of 94.1%, a difference of 1.1%.
African vs Hmong 10th Grade

10th Grade Correlation Summary

MeasurementAfricanHmong
Minimum81.1%89.3%
Maximum100.0%99.2%
Range18.9%9.9%
Mean93.8%95.0%
Median93.6%95.6%
Interquartile 25% (IQ1)92.0%94.1%
Interquartile 75% (IQ3)96.1%96.7%
Interquartile Range (IQR)4.0%2.6%
Standard Deviation (Sample)4.4%2.5%
Standard Deviation (Population)4.4%2.5%

Similar Demographics by 10th Grade

Demographics Similar to Africans by 10th Grade

In terms of 10th grade, the demographic groups most similar to Africans are Afghan (93.1%, a difference of 0.0%), South American Indian (93.1%, a difference of 0.010%), Bahamian (93.1%, a difference of 0.010%), Comanche (93.1%, a difference of 0.010%), and Subsaharan African (93.1%, a difference of 0.010%).
DemographicsRating | Rank10th Grade
Immigrants | China
5.9
/100
|
#228
Tragic
93.2%
Immigrants | Ethiopia
5.1
/100
|
#229
Tragic
93.1%
Immigrants | Africa
5.0
/100
|
#230
Tragic
93.1%
South American Indians
4.9
/100
|
#231
Tragic
93.1%
Bahamians
4.9
/100
|
#232
Tragic
93.1%
Comanche
4.9
/100
|
#233
Tragic
93.1%
Sub-Saharan Africans
4.7
/100
|
#234
Tragic
93.1%
Africans
4.6
/100
|
#235
Tragic
93.1%
Afghans
4.5
/100
|
#236
Tragic
93.1%
Immigrants | Panama
4.3
/100
|
#237
Tragic
93.1%
Nigerians
4.2
/100
|
#238
Tragic
93.1%
Costa Ricans
4.2
/100
|
#239
Tragic
93.1%
Immigrants | Hong Kong
4.2
/100
|
#240
Tragic
93.1%
Immigrants | Somalia
2.7
/100
|
#241
Tragic
93.0%
Immigrants | Cameroon
2.6
/100
|
#242
Tragic
93.0%

Demographics Similar to Hmong by 10th Grade

In terms of 10th grade, the demographic groups most similar to Hmong are Albanian (94.1%, a difference of 0.0%), Immigrants from Jordan (94.1%, a difference of 0.020%), Cherokee (94.1%, a difference of 0.030%), Immigrants from Kazakhstan (94.1%, a difference of 0.030%), and Nonimmigrants (94.1%, a difference of 0.050%).
DemographicsRating | Rank10th Grade
Osage
91.7
/100
|
#134
Exceptional
94.2%
Immigrants | Korea
91.3
/100
|
#135
Exceptional
94.2%
Shoshone
90.8
/100
|
#136
Exceptional
94.2%
Arapaho
90.5
/100
|
#137
Exceptional
94.2%
Immigrants | Sri Lanka
89.9
/100
|
#138
Excellent
94.2%
Immigrants | Bosnia and Herzegovina
89.4
/100
|
#139
Excellent
94.2%
Immigrants | Jordan
87.6
/100
|
#140
Excellent
94.1%
Hmong
86.6
/100
|
#141
Excellent
94.1%
Albanians
86.5
/100
|
#142
Excellent
94.1%
Cherokee
84.9
/100
|
#143
Excellent
94.1%
Immigrants | Kazakhstan
84.9
/100
|
#144
Excellent
94.1%
Immigrants | Nonimmigrants
83.8
/100
|
#145
Excellent
94.1%
Chickasaw
82.6
/100
|
#146
Excellent
94.1%
Immigrants | Ukraine
81.5
/100
|
#147
Excellent
94.0%
Arabs
80.9
/100
|
#148
Excellent
94.0%