Liberian vs Immigrants from Grenada 5th Grade
COMPARE
Liberian
Immigrants from Grenada
5th Grade
5th Grade Comparison
Liberians
Immigrants from Grenada
97.0%
5TH GRADE
5.7/ 100
METRIC RATING
223rd/ 347
METRIC RANK
96.5%
5TH GRADE
0.0/ 100
METRIC RATING
293rd/ 347
METRIC RANK
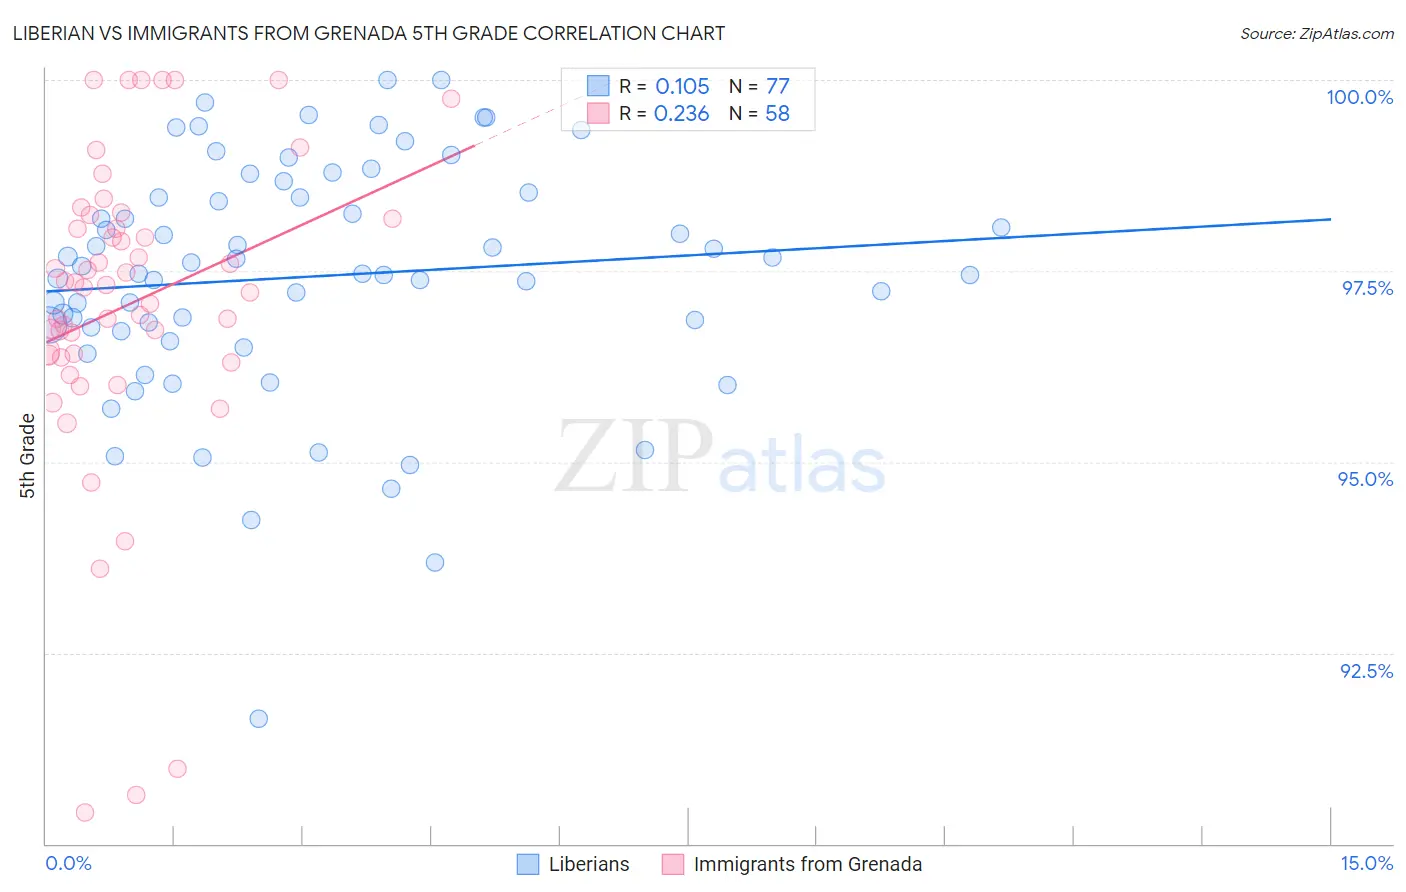
Liberian vs Immigrants from Grenada 5th Grade Correlation Chart
The statistical analysis conducted on geographies consisting of 118,085,461 people shows a poor positive correlation between the proportion of Liberians and percentage of population with at least 5th grade education in the United States with a correlation coefficient (R) of 0.105 and weighted average of 97.0%. Similarly, the statistical analysis conducted on geographies consisting of 67,199,790 people shows a weak positive correlation between the proportion of Immigrants from Grenada and percentage of population with at least 5th grade education in the United States with a correlation coefficient (R) of 0.236 and weighted average of 96.5%, a difference of 0.61%.
5th Grade Correlation Summary
| Measurement | Liberian | Immigrants from Grenada |
| Minimum | 91.6% | 90.4% |
| Maximum | 100.0% | 100.0% |
| Range | 8.4% | 9.6% |
| Mean | 97.4% | 97.1% |
| Median | 97.5% | 97.3% |
| Interquartile 25% (IQ1) | 96.7% | 96.4% |
| Interquartile 75% (IQ3) | 98.5% | 98.2% |
| Interquartile Range (IQR) | 1.8% | 1.8% |
| Standard Deviation (Sample) | 1.6% | 2.1% |
| Standard Deviation (Population) | 1.6% | 2.1% |
Similar Demographics by 5th Grade
Demographics Similar to Liberians by 5th Grade
In terms of 5th grade, the demographic groups most similar to Liberians are Immigrants from Panama (97.0%, a difference of 0.0%), South American Indian (97.0%, a difference of 0.0%), Immigrants from Syria (97.1%, a difference of 0.010%), Immigrants from Southern Europe (97.1%, a difference of 0.010%), and Sierra Leonean (97.1%, a difference of 0.010%).
| Demographics | Rating | Rank | 5th Grade |
| Sudanese | 7.0 /100 | #216 | Tragic 97.1% |
| Immigrants | Lebanon | 6.8 /100 | #217 | Tragic 97.1% |
| Immigrants | Sudan | 6.5 /100 | #218 | Tragic 97.1% |
| Immigrants | Syria | 6.4 /100 | #219 | Tragic 97.1% |
| Immigrants | Southern Europe | 6.3 /100 | #220 | Tragic 97.1% |
| Sierra Leoneans | 6.0 /100 | #221 | Tragic 97.1% |
| Immigrants | Panama | 5.7 /100 | #222 | Tragic 97.0% |
| Liberians | 5.7 /100 | #223 | Tragic 97.0% |
| South American Indians | 5.4 /100 | #224 | Tragic 97.0% |
| Bahamians | 5.3 /100 | #225 | Tragic 97.0% |
| Tongans | 5.3 /100 | #226 | Tragic 97.0% |
| Immigrants | Pakistan | 4.7 /100 | #227 | Tragic 97.0% |
| Assyrians/Chaldeans/Syriacs | 4.5 /100 | #228 | Tragic 97.0% |
| Yuman | 4.5 /100 | #229 | Tragic 97.0% |
| Immigrants | Western Asia | 4.3 /100 | #230 | Tragic 97.0% |
Demographics Similar to Immigrants from Grenada by 5th Grade
In terms of 5th grade, the demographic groups most similar to Immigrants from Grenada are Somali (96.5%, a difference of 0.010%), British West Indian (96.5%, a difference of 0.020%), Malaysian (96.5%, a difference of 0.020%), Immigrants from West Indies (96.5%, a difference of 0.040%), and Immigrants from Eritrea (96.4%, a difference of 0.040%).
| Demographics | Rating | Rank | 5th Grade |
| Immigrants | Thailand | 0.1 /100 | #286 | Tragic 96.6% |
| Immigrants | Afghanistan | 0.1 /100 | #287 | Tragic 96.6% |
| Immigrants | Barbados | 0.0 /100 | #288 | Tragic 96.6% |
| Immigrants | West Indies | 0.0 /100 | #289 | Tragic 96.5% |
| British West Indians | 0.0 /100 | #290 | Tragic 96.5% |
| Malaysians | 0.0 /100 | #291 | Tragic 96.5% |
| Somalis | 0.0 /100 | #292 | Tragic 96.5% |
| Immigrants | Grenada | 0.0 /100 | #293 | Tragic 96.5% |
| Immigrants | Eritrea | 0.0 /100 | #294 | Tragic 96.4% |
| Immigrants | Somalia | 0.0 /100 | #295 | Tragic 96.4% |
| Immigrants | South Eastern Asia | 0.0 /100 | #296 | Tragic 96.3% |
| Haitians | 0.0 /100 | #297 | Tragic 96.3% |
| Immigrants | Dominica | 0.0 /100 | #298 | Tragic 96.2% |
| Immigrants | Immigrants | 0.0 /100 | #299 | Tragic 96.2% |
| Sri Lankans | 0.0 /100 | #300 | Tragic 96.1% |