Kenyan vs Immigrants from Grenada 5th Grade
COMPARE
Kenyan
Immigrants from Grenada
5th Grade
5th Grade Comparison
Kenyans
Immigrants from Grenada
97.4%
5TH GRADE
59.7/ 100
METRIC RATING
161st/ 347
METRIC RANK
96.5%
5TH GRADE
0.0/ 100
METRIC RATING
293rd/ 347
METRIC RANK
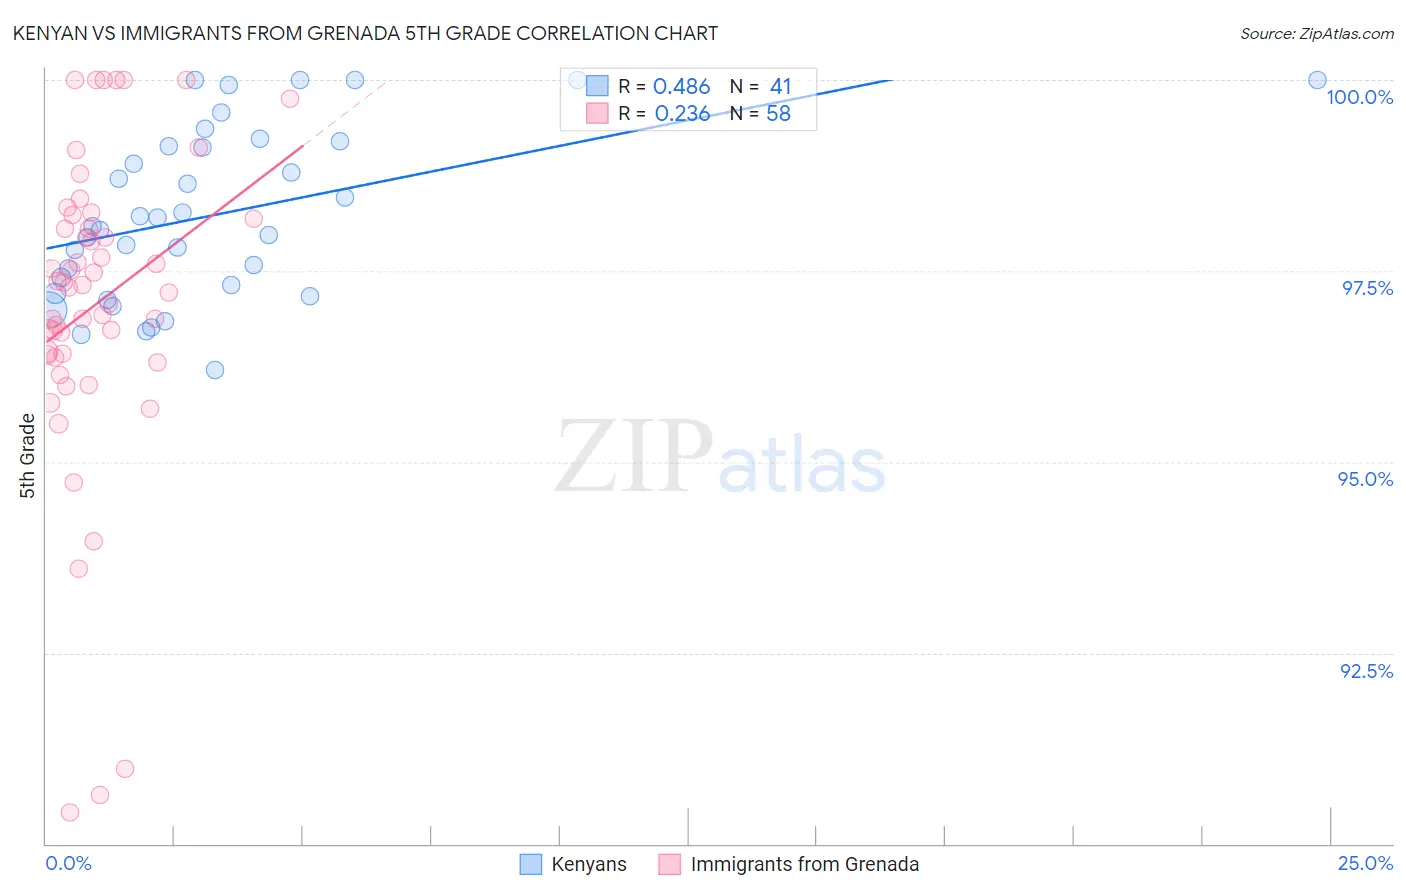
Kenyan vs Immigrants from Grenada 5th Grade Correlation Chart
The statistical analysis conducted on geographies consisting of 168,244,042 people shows a moderate positive correlation between the proportion of Kenyans and percentage of population with at least 5th grade education in the United States with a correlation coefficient (R) of 0.486 and weighted average of 97.4%. Similarly, the statistical analysis conducted on geographies consisting of 67,199,790 people shows a weak positive correlation between the proportion of Immigrants from Grenada and percentage of population with at least 5th grade education in the United States with a correlation coefficient (R) of 0.236 and weighted average of 96.5%, a difference of 0.94%.
5th Grade Correlation Summary
| Measurement | Kenyan | Immigrants from Grenada |
| Minimum | 96.2% | 90.4% |
| Maximum | 100.0% | 100.0% |
| Range | 3.8% | 9.6% |
| Mean | 98.2% | 97.1% |
| Median | 98.1% | 97.3% |
| Interquartile 25% (IQ1) | 97.3% | 96.4% |
| Interquartile 75% (IQ3) | 99.2% | 98.2% |
| Interquartile Range (IQR) | 1.9% | 1.8% |
| Standard Deviation (Sample) | 1.1% | 2.1% |
| Standard Deviation (Population) | 1.1% | 2.1% |
Similar Demographics by 5th Grade
Demographics Similar to Kenyans by 5th Grade
In terms of 5th grade, the demographic groups most similar to Kenyans are Immigrants from Iran (97.4%, a difference of 0.0%), Ugandan (97.4%, a difference of 0.0%), Bermudan (97.4%, a difference of 0.0%), Marshallese (97.4%, a difference of 0.010%), and Immigrants from Poland (97.4%, a difference of 0.010%).
| Demographics | Rating | Rank | 5th Grade |
| Immigrants | Russia | 71.2 /100 | #154 | Good 97.4% |
| Immigrants | Bosnia and Herzegovina | 71.0 /100 | #155 | Good 97.4% |
| French American Indians | 70.5 /100 | #156 | Good 97.4% |
| Immigrants | Jordan | 70.4 /100 | #157 | Good 97.4% |
| Albanians | 68.3 /100 | #158 | Good 97.4% |
| Immigrants | Italy | 65.2 /100 | #159 | Good 97.4% |
| Marshallese | 61.2 /100 | #160 | Good 97.4% |
| Kenyans | 59.7 /100 | #161 | Average 97.4% |
| Immigrants | Iran | 59.5 /100 | #162 | Average 97.4% |
| Ugandans | 58.9 /100 | #163 | Average 97.4% |
| Bermudans | 58.8 /100 | #164 | Average 97.4% |
| Immigrants | Poland | 57.9 /100 | #165 | Average 97.4% |
| Apache | 57.2 /100 | #166 | Average 97.4% |
| Immigrants | Belarus | 54.6 /100 | #167 | Average 97.3% |
| Chileans | 54.5 /100 | #168 | Average 97.3% |
Demographics Similar to Immigrants from Grenada by 5th Grade
In terms of 5th grade, the demographic groups most similar to Immigrants from Grenada are Somali (96.5%, a difference of 0.010%), British West Indian (96.5%, a difference of 0.020%), Malaysian (96.5%, a difference of 0.020%), Immigrants from West Indies (96.5%, a difference of 0.040%), and Immigrants from Eritrea (96.4%, a difference of 0.040%).
| Demographics | Rating | Rank | 5th Grade |
| Immigrants | Thailand | 0.1 /100 | #286 | Tragic 96.6% |
| Immigrants | Afghanistan | 0.1 /100 | #287 | Tragic 96.6% |
| Immigrants | Barbados | 0.0 /100 | #288 | Tragic 96.6% |
| Immigrants | West Indies | 0.0 /100 | #289 | Tragic 96.5% |
| British West Indians | 0.0 /100 | #290 | Tragic 96.5% |
| Malaysians | 0.0 /100 | #291 | Tragic 96.5% |
| Somalis | 0.0 /100 | #292 | Tragic 96.5% |
| Immigrants | Grenada | 0.0 /100 | #293 | Tragic 96.5% |
| Immigrants | Eritrea | 0.0 /100 | #294 | Tragic 96.4% |
| Immigrants | Somalia | 0.0 /100 | #295 | Tragic 96.4% |
| Immigrants | South Eastern Asia | 0.0 /100 | #296 | Tragic 96.3% |
| Haitians | 0.0 /100 | #297 | Tragic 96.3% |
| Immigrants | Dominica | 0.0 /100 | #298 | Tragic 96.2% |
| Immigrants | Immigrants | 0.0 /100 | #299 | Tragic 96.2% |
| Sri Lankans | 0.0 /100 | #300 | Tragic 96.1% |