African vs Immigrants from Iran 5th Grade
COMPARE
African
Immigrants from Iran
5th Grade
5th Grade Comparison
Africans
Immigrants from Iran
97.2%
5TH GRADE
15.3/ 100
METRIC RATING
202nd/ 347
METRIC RANK
97.4%
5TH GRADE
59.5/ 100
METRIC RATING
162nd/ 347
METRIC RANK
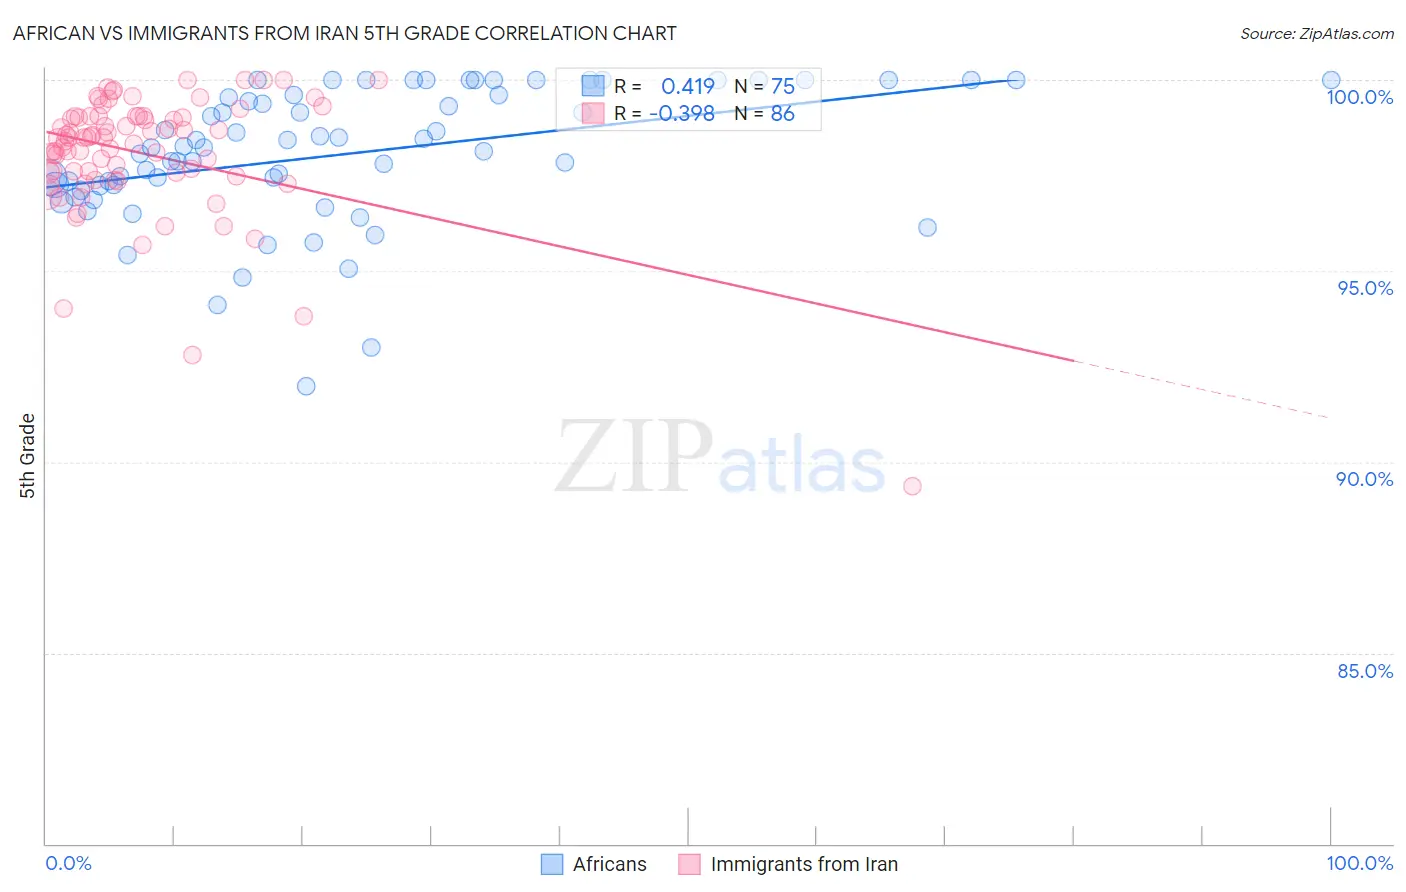
African vs Immigrants from Iran 5th Grade Correlation Chart
The statistical analysis conducted on geographies consisting of 470,094,744 people shows a moderate positive correlation between the proportion of Africans and percentage of population with at least 5th grade education in the United States with a correlation coefficient (R) of 0.419 and weighted average of 97.2%. Similarly, the statistical analysis conducted on geographies consisting of 279,867,553 people shows a mild negative correlation between the proportion of Immigrants from Iran and percentage of population with at least 5th grade education in the United States with a correlation coefficient (R) of -0.398 and weighted average of 97.4%, a difference of 0.22%.
5th Grade Correlation Summary
| Measurement | African | Immigrants from Iran |
| Minimum | 92.0% | 89.4% |
| Maximum | 100.0% | 100.0% |
| Range | 8.0% | 10.6% |
| Mean | 98.1% | 98.1% |
| Median | 98.2% | 98.5% |
| Interquartile 25% (IQ1) | 97.2% | 97.6% |
| Interquartile 75% (IQ3) | 99.6% | 99.0% |
| Interquartile Range (IQR) | 2.4% | 1.5% |
| Standard Deviation (Sample) | 1.8% | 1.7% |
| Standard Deviation (Population) | 1.8% | 1.6% |
Similar Demographics by 5th Grade
Demographics Similar to Africans by 5th Grade
In terms of 5th grade, the demographic groups most similar to Africans are Immigrants from Bahamas (97.2%, a difference of 0.0%), Immigrants from Northern Africa (97.2%, a difference of 0.010%), Immigrants from Chile (97.2%, a difference of 0.010%), Immigrants from Zaire (97.1%, a difference of 0.010%), and Native/Alaskan (97.2%, a difference of 0.020%).
| Demographics | Rating | Rank | 5th Grade |
| Guamanians/Chamorros | 26.8 /100 | #195 | Fair 97.2% |
| Hawaiians | 25.6 /100 | #196 | Fair 97.2% |
| Brazilians | 25.4 /100 | #197 | Fair 97.2% |
| Immigrants | Uganda | 21.1 /100 | #198 | Fair 97.2% |
| Natives/Alaskans | 18.0 /100 | #199 | Poor 97.2% |
| Immigrants | Northern Africa | 16.8 /100 | #200 | Poor 97.2% |
| Immigrants | Chile | 16.6 /100 | #201 | Poor 97.2% |
| Africans | 15.3 /100 | #202 | Poor 97.2% |
| Immigrants | Bahamas | 14.9 /100 | #203 | Poor 97.2% |
| Immigrants | Zaire | 13.7 /100 | #204 | Poor 97.1% |
| Moroccans | 12.0 /100 | #205 | Poor 97.1% |
| Paiute | 11.6 /100 | #206 | Poor 97.1% |
| Iraqis | 10.9 /100 | #207 | Poor 97.1% |
| Laotians | 10.8 /100 | #208 | Poor 97.1% |
| Immigrants | Nepal | 10.3 /100 | #209 | Poor 97.1% |
Demographics Similar to Immigrants from Iran by 5th Grade
In terms of 5th grade, the demographic groups most similar to Immigrants from Iran are Kenyan (97.4%, a difference of 0.0%), Ugandan (97.4%, a difference of 0.0%), Bermudan (97.4%, a difference of 0.0%), Marshallese (97.4%, a difference of 0.010%), and Immigrants from Poland (97.4%, a difference of 0.010%).
| Demographics | Rating | Rank | 5th Grade |
| Immigrants | Bosnia and Herzegovina | 71.0 /100 | #155 | Good 97.4% |
| French American Indians | 70.5 /100 | #156 | Good 97.4% |
| Immigrants | Jordan | 70.4 /100 | #157 | Good 97.4% |
| Albanians | 68.3 /100 | #158 | Good 97.4% |
| Immigrants | Italy | 65.2 /100 | #159 | Good 97.4% |
| Marshallese | 61.2 /100 | #160 | Good 97.4% |
| Kenyans | 59.7 /100 | #161 | Average 97.4% |
| Immigrants | Iran | 59.5 /100 | #162 | Average 97.4% |
| Ugandans | 58.9 /100 | #163 | Average 97.4% |
| Bermudans | 58.8 /100 | #164 | Average 97.4% |
| Immigrants | Poland | 57.9 /100 | #165 | Average 97.4% |
| Apache | 57.2 /100 | #166 | Average 97.4% |
| Immigrants | Belarus | 54.6 /100 | #167 | Average 97.3% |
| Chileans | 54.5 /100 | #168 | Average 97.3% |
| Immigrants | Korea | 54.1 /100 | #169 | Average 97.3% |