Zimbabwean vs Immigrants from Armenia Disability
COMPARE
Zimbabwean
Immigrants from Armenia
Disability
Disability Comparison
Zimbabweans
Immigrants from Armenia
10.9%
DISABILITY
99.7/ 100
METRIC RATING
60th/ 347
METRIC RANK
11.7%
DISABILITY
41.9/ 100
METRIC RATING
179th/ 347
METRIC RANK
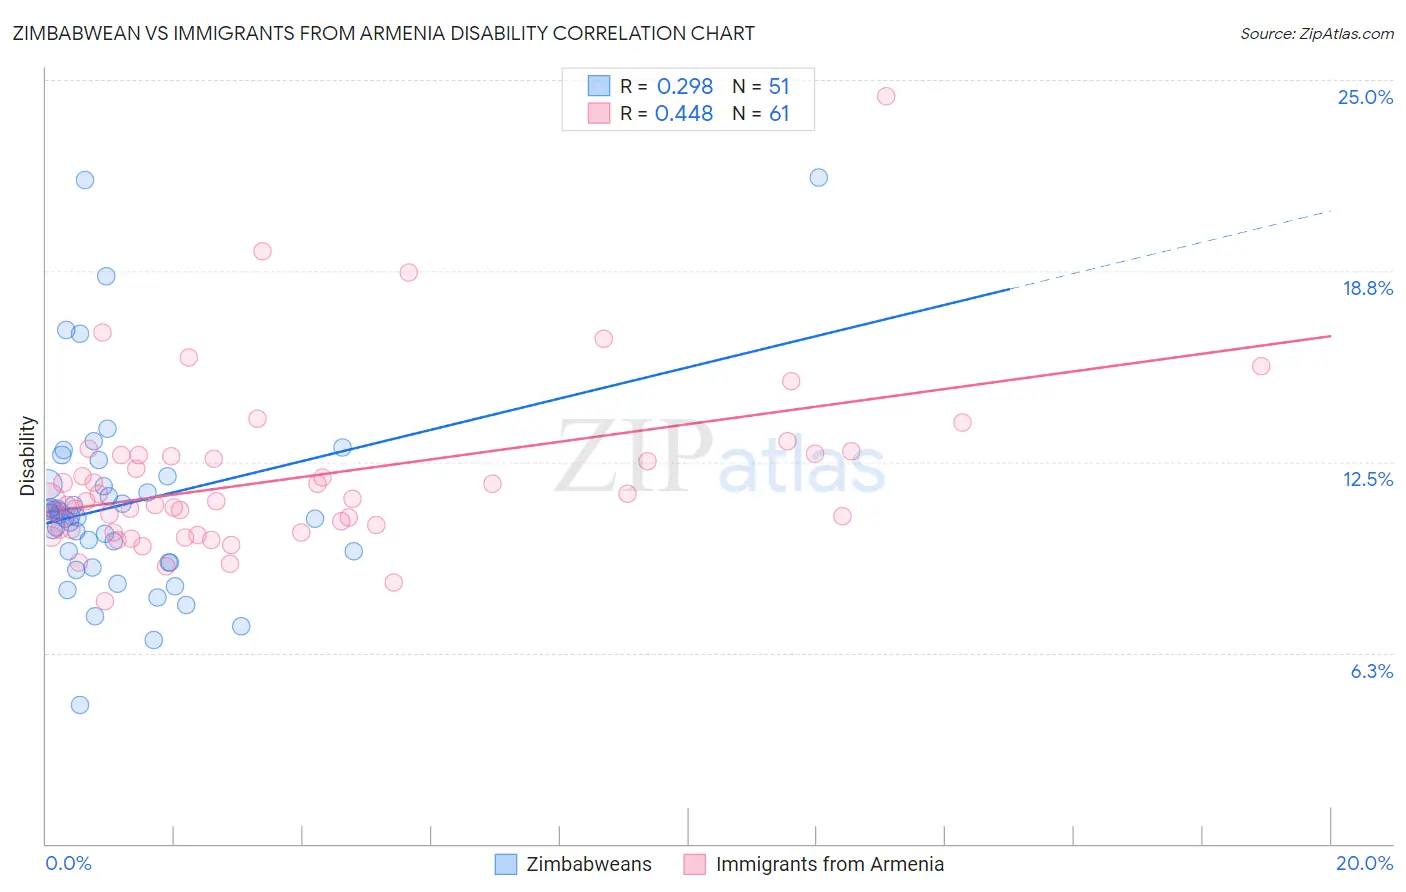
Zimbabwean vs Immigrants from Armenia Disability Correlation Chart
The statistical analysis conducted on geographies consisting of 69,206,588 people shows a weak positive correlation between the proportion of Zimbabweans and percentage of population with a disability in the United States with a correlation coefficient (R) of 0.298 and weighted average of 10.9%. Similarly, the statistical analysis conducted on geographies consisting of 97,710,593 people shows a moderate positive correlation between the proportion of Immigrants from Armenia and percentage of population with a disability in the United States with a correlation coefficient (R) of 0.448 and weighted average of 11.7%, a difference of 7.3%.
Disability Correlation Summary
| Measurement | Zimbabwean | Immigrants from Armenia |
| Minimum | 4.5% | 7.9% |
| Maximum | 21.8% | 24.5% |
| Range | 17.3% | 16.5% |
| Mean | 11.1% | 12.0% |
| Median | 10.7% | 11.2% |
| Interquartile 25% (IQ1) | 9.2% | 10.3% |
| Interquartile 75% (IQ3) | 11.8% | 12.7% |
| Interquartile Range (IQR) | 2.5% | 2.5% |
| Standard Deviation (Sample) | 3.3% | 2.8% |
| Standard Deviation (Population) | 3.2% | 2.8% |
Similar Demographics by Disability
Demographics Similar to Zimbabweans by Disability
In terms of disability, the demographic groups most similar to Zimbabweans are Immigrants from Bulgaria (10.9%, a difference of 0.060%), Immigrants from Colombia (10.9%, a difference of 0.090%), Immigrants from Northern Africa (10.9%, a difference of 0.10%), Immigrants from Eritrea (11.0%, a difference of 0.11%), and Immigrants from South America (10.9%, a difference of 0.18%).
| Demographics | Rating | Rank | Disability |
| Immigrants | Spain | 99.8 /100 | #53 | Exceptional 10.9% |
| Jordanians | 99.8 /100 | #54 | Exceptional 10.9% |
| Immigrants | El Salvador | 99.8 /100 | #55 | Exceptional 10.9% |
| Immigrants | Lithuania | 99.8 /100 | #56 | Exceptional 10.9% |
| Salvadorans | 99.8 /100 | #57 | Exceptional 10.9% |
| Immigrants | South America | 99.8 /100 | #58 | Exceptional 10.9% |
| Immigrants | Colombia | 99.7 /100 | #59 | Exceptional 10.9% |
| Zimbabweans | 99.7 /100 | #60 | Exceptional 10.9% |
| Immigrants | Bulgaria | 99.7 /100 | #61 | Exceptional 10.9% |
| Immigrants | Northern Africa | 99.7 /100 | #62 | Exceptional 10.9% |
| Immigrants | Eritrea | 99.7 /100 | #63 | Exceptional 11.0% |
| Immigrants | Sweden | 99.6 /100 | #64 | Exceptional 11.0% |
| Bulgarians | 99.6 /100 | #65 | Exceptional 11.0% |
| Laotians | 99.6 /100 | #66 | Exceptional 11.0% |
| Colombians | 99.6 /100 | #67 | Exceptional 11.0% |
Demographics Similar to Immigrants from Armenia by Disability
In terms of disability, the demographic groups most similar to Immigrants from Armenia are Greek (11.7%, a difference of 0.19%), Immigrants from Honduras (11.8%, a difference of 0.19%), Immigrants from Central America (11.7%, a difference of 0.21%), Immigrants from Western Africa (11.7%, a difference of 0.25%), and Haitian (11.7%, a difference of 0.30%).
| Demographics | Rating | Rank | Disability |
| Trinidadians and Tobagonians | 52.7 /100 | #172 | Average 11.7% |
| Maltese | 50.6 /100 | #173 | Average 11.7% |
| Albanians | 50.0 /100 | #174 | Average 11.7% |
| Haitians | 48.6 /100 | #175 | Average 11.7% |
| Immigrants | Western Africa | 47.5 /100 | #176 | Average 11.7% |
| Immigrants | Central America | 46.6 /100 | #177 | Average 11.7% |
| Greeks | 46.2 /100 | #178 | Average 11.7% |
| Immigrants | Armenia | 41.9 /100 | #179 | Average 11.7% |
| Immigrants | Honduras | 37.8 /100 | #180 | Fair 11.8% |
| Immigrants | Oceania | 34.3 /100 | #181 | Fair 11.8% |
| Icelanders | 34.0 /100 | #182 | Fair 11.8% |
| Hondurans | 31.2 /100 | #183 | Fair 11.8% |
| Iraqis | 30.0 /100 | #184 | Fair 11.8% |
| Immigrants | Burma/Myanmar | 28.5 /100 | #185 | Fair 11.8% |
| Immigrants | Scotland | 28.2 /100 | #186 | Fair 11.8% |