Zimbabwean vs Immigrants from Moldova Disability
COMPARE
Zimbabwean
Immigrants from Moldova
Disability
Disability Comparison
Zimbabweans
Immigrants from Moldova
10.9%
DISABILITY
99.7/ 100
METRIC RATING
60th/ 347
METRIC RANK
11.6%
DISABILITY
72.0/ 100
METRIC RATING
152nd/ 347
METRIC RANK
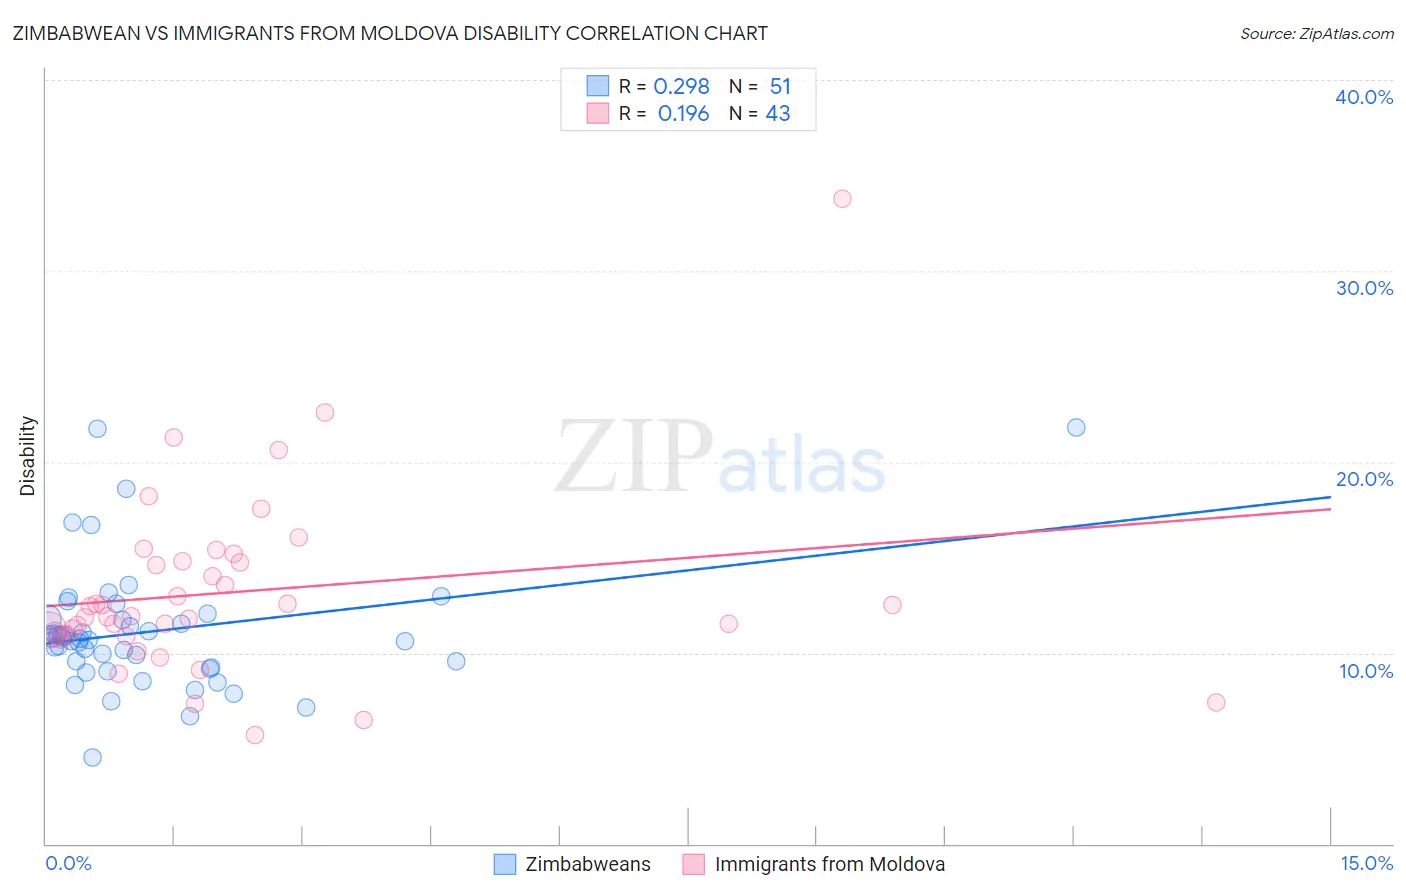
Zimbabwean vs Immigrants from Moldova Disability Correlation Chart
The statistical analysis conducted on geographies consisting of 69,206,588 people shows a weak positive correlation between the proportion of Zimbabweans and percentage of population with a disability in the United States with a correlation coefficient (R) of 0.298 and weighted average of 10.9%. Similarly, the statistical analysis conducted on geographies consisting of 124,386,005 people shows a poor positive correlation between the proportion of Immigrants from Moldova and percentage of population with a disability in the United States with a correlation coefficient (R) of 0.196 and weighted average of 11.6%, a difference of 5.8%.
Disability Correlation Summary
| Measurement | Zimbabwean | Immigrants from Moldova |
| Minimum | 4.5% | 5.7% |
| Maximum | 21.8% | 33.8% |
| Range | 17.3% | 28.1% |
| Mean | 11.1% | 13.2% |
| Median | 10.7% | 11.9% |
| Interquartile 25% (IQ1) | 9.2% | 10.9% |
| Interquartile 75% (IQ3) | 11.8% | 14.8% |
| Interquartile Range (IQR) | 2.5% | 3.9% |
| Standard Deviation (Sample) | 3.3% | 4.8% |
| Standard Deviation (Population) | 3.2% | 4.8% |
Similar Demographics by Disability
Demographics Similar to Zimbabweans by Disability
In terms of disability, the demographic groups most similar to Zimbabweans are Immigrants from Bulgaria (10.9%, a difference of 0.060%), Immigrants from Colombia (10.9%, a difference of 0.090%), Immigrants from Northern Africa (10.9%, a difference of 0.10%), Immigrants from Eritrea (11.0%, a difference of 0.11%), and Immigrants from South America (10.9%, a difference of 0.18%).
| Demographics | Rating | Rank | Disability |
| Immigrants | Spain | 99.8 /100 | #53 | Exceptional 10.9% |
| Jordanians | 99.8 /100 | #54 | Exceptional 10.9% |
| Immigrants | El Salvador | 99.8 /100 | #55 | Exceptional 10.9% |
| Immigrants | Lithuania | 99.8 /100 | #56 | Exceptional 10.9% |
| Salvadorans | 99.8 /100 | #57 | Exceptional 10.9% |
| Immigrants | South America | 99.8 /100 | #58 | Exceptional 10.9% |
| Immigrants | Colombia | 99.7 /100 | #59 | Exceptional 10.9% |
| Zimbabweans | 99.7 /100 | #60 | Exceptional 10.9% |
| Immigrants | Bulgaria | 99.7 /100 | #61 | Exceptional 10.9% |
| Immigrants | Northern Africa | 99.7 /100 | #62 | Exceptional 10.9% |
| Immigrants | Eritrea | 99.7 /100 | #63 | Exceptional 11.0% |
| Immigrants | Sweden | 99.6 /100 | #64 | Exceptional 11.0% |
| Bulgarians | 99.6 /100 | #65 | Exceptional 11.0% |
| Laotians | 99.6 /100 | #66 | Exceptional 11.0% |
| Colombians | 99.6 /100 | #67 | Exceptional 11.0% |
Demographics Similar to Immigrants from Moldova by Disability
In terms of disability, the demographic groups most similar to Immigrants from Moldova are Immigrants from Kenya (11.6%, a difference of 0.0%), Romanian (11.6%, a difference of 0.040%), Immigrants from Ghana (11.6%, a difference of 0.050%), Immigrants from Guatemala (11.6%, a difference of 0.050%), and Immigrants from Norway (11.6%, a difference of 0.060%).
| Demographics | Rating | Rank | Disability |
| Nigerians | 81.3 /100 | #145 | Excellent 11.5% |
| Immigrants | Hungary | 79.0 /100 | #146 | Good 11.5% |
| Immigrants | Ukraine | 77.6 /100 | #147 | Good 11.5% |
| Sudanese | 77.1 /100 | #148 | Good 11.5% |
| Immigrants | Norway | 73.2 /100 | #149 | Good 11.6% |
| Romanians | 72.7 /100 | #150 | Good 11.6% |
| Immigrants | Kenya | 72.1 /100 | #151 | Good 11.6% |
| Immigrants | Moldova | 72.0 /100 | #152 | Good 11.6% |
| Immigrants | Ghana | 71.2 /100 | #153 | Good 11.6% |
| Immigrants | Guatemala | 71.1 /100 | #154 | Good 11.6% |
| Immigrants | Netherlands | 69.8 /100 | #155 | Good 11.6% |
| Immigrants | Fiji | 69.5 /100 | #156 | Good 11.6% |
| Immigrants | Middle Africa | 69.5 /100 | #157 | Good 11.6% |
| Armenians | 65.9 /100 | #158 | Good 11.6% |
| Guatemalans | 65.1 /100 | #159 | Good 11.6% |