Zimbabwean vs Immigrants from Armenia Disability Age Over 75
COMPARE
Zimbabwean
Immigrants from Armenia
Disability Age Over 75
Disability Age Over 75 Comparison
Zimbabweans
Immigrants from Armenia
48.1%
DISABILITY AGE OVER 75
6.4/ 100
METRIC RATING
227th/ 347
METRIC RANK
54.3%
DISABILITY AGE OVER 75
0.0/ 100
METRIC RATING
336th/ 347
METRIC RANK
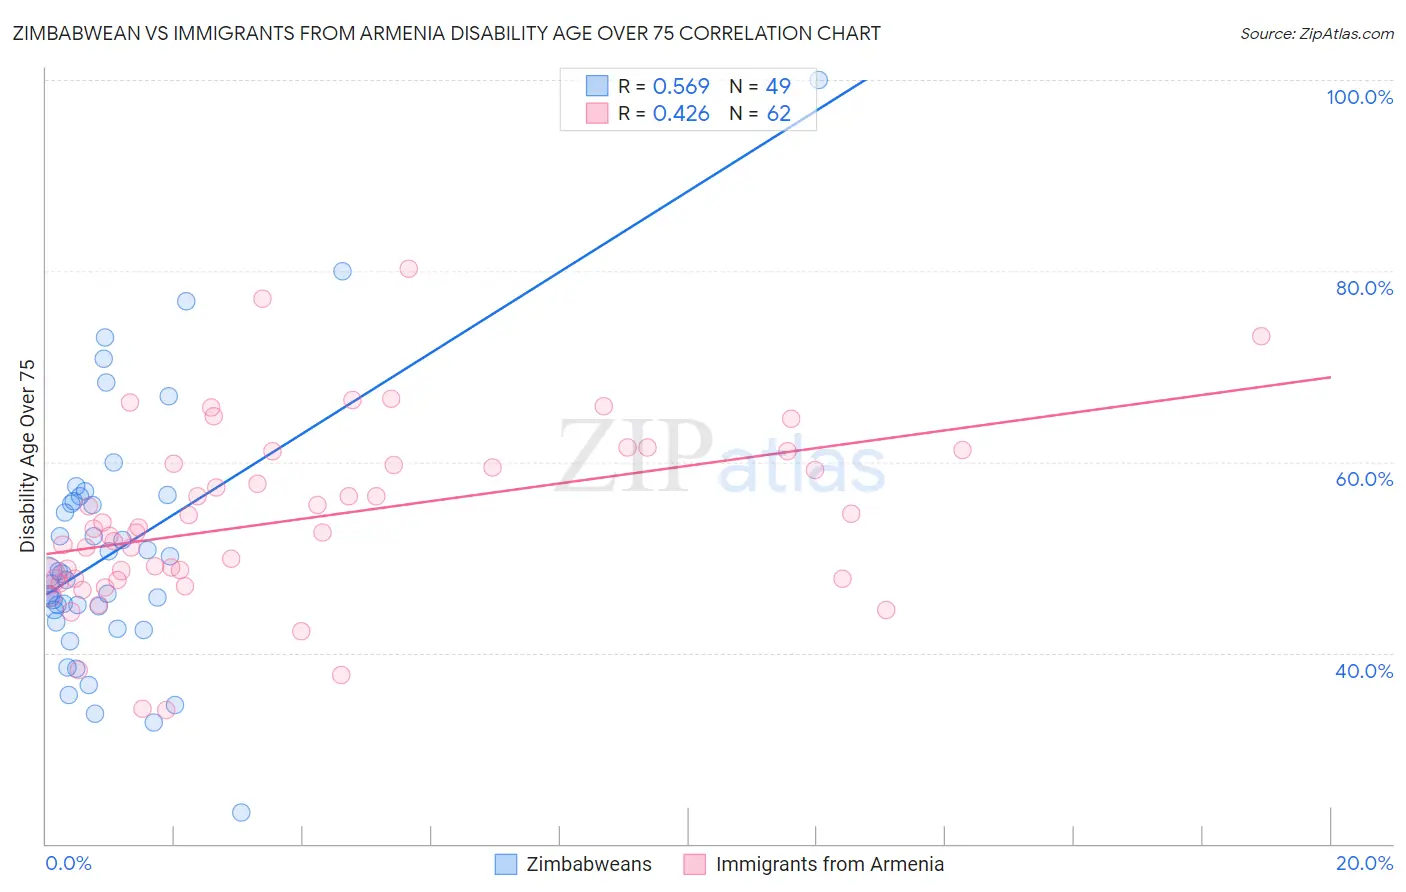
Zimbabwean vs Immigrants from Armenia Disability Age Over 75 Correlation Chart
The statistical analysis conducted on geographies consisting of 69,112,406 people shows a substantial positive correlation between the proportion of Zimbabweans and percentage of population with a disability over the age of 75 in the United States with a correlation coefficient (R) of 0.569 and weighted average of 48.1%. Similarly, the statistical analysis conducted on geographies consisting of 97,687,022 people shows a moderate positive correlation between the proportion of Immigrants from Armenia and percentage of population with a disability over the age of 75 in the United States with a correlation coefficient (R) of 0.426 and weighted average of 54.3%, a difference of 13.1%.
Disability Age Over 75 Correlation Summary
| Measurement | Zimbabwean | Immigrants from Armenia |
| Minimum | 23.2% | 34.0% |
| Maximum | 100.0% | 80.2% |
| Range | 76.8% | 46.2% |
| Mean | 50.8% | 54.0% |
| Median | 48.2% | 52.8% |
| Interquartile 25% (IQ1) | 43.9% | 47.7% |
| Interquartile 75% (IQ3) | 56.1% | 59.8% |
| Interquartile Range (IQR) | 12.3% | 12.1% |
| Standard Deviation (Sample) | 13.5% | 9.4% |
| Standard Deviation (Population) | 13.4% | 9.3% |
Similar Demographics by Disability Age Over 75
Demographics Similar to Zimbabweans by Disability Age Over 75
In terms of disability age over 75, the demographic groups most similar to Zimbabweans are Spanish (48.0%, a difference of 0.010%), Nonimmigrants (48.0%, a difference of 0.010%), Liberian (48.0%, a difference of 0.020%), Immigrants from Bangladesh (48.0%, a difference of 0.030%), and Barbadian (48.0%, a difference of 0.040%).
| Demographics | Rating | Rank | Disability Age Over 75 |
| Bahamians | 7.4 /100 | #220 | Tragic 48.0% |
| Immigrants | Oceania | 7.3 /100 | #221 | Tragic 48.0% |
| Barbadians | 6.8 /100 | #222 | Tragic 48.0% |
| Immigrants | Bangladesh | 6.8 /100 | #223 | Tragic 48.0% |
| Liberians | 6.7 /100 | #224 | Tragic 48.0% |
| Spanish | 6.5 /100 | #225 | Tragic 48.0% |
| Immigrants | Nonimmigrants | 6.5 /100 | #226 | Tragic 48.0% |
| Zimbabweans | 6.4 /100 | #227 | Tragic 48.1% |
| Immigrants | Liberia | 5.9 /100 | #228 | Tragic 48.1% |
| Spaniards | 5.7 /100 | #229 | Tragic 48.1% |
| Taiwanese | 4.4 /100 | #230 | Tragic 48.2% |
| Immigrants | Immigrants | 4.3 /100 | #231 | Tragic 48.2% |
| Indonesians | 4.2 /100 | #232 | Tragic 48.2% |
| Cree | 4.2 /100 | #233 | Tragic 48.2% |
| Sub-Saharan Africans | 3.8 /100 | #234 | Tragic 48.2% |
Demographics Similar to Immigrants from Armenia by Disability Age Over 75
In terms of disability age over 75, the demographic groups most similar to Immigrants from Armenia are Yuman (54.4%, a difference of 0.16%), Kiowa (54.2%, a difference of 0.17%), Alaskan Athabascan (54.0%, a difference of 0.69%), Apache (53.6%, a difference of 1.4%), and Colville (55.4%, a difference of 1.9%).
| Demographics | Rating | Rank | Disability Age Over 75 |
| Alaska Natives | 0.0 /100 | #329 | Tragic 52.8% |
| Puerto Ricans | 0.0 /100 | #330 | Tragic 52.9% |
| Hopi | 0.0 /100 | #331 | Tragic 52.9% |
| Natives/Alaskans | 0.0 /100 | #332 | Tragic 53.1% |
| Apache | 0.0 /100 | #333 | Tragic 53.6% |
| Alaskan Athabascans | 0.0 /100 | #334 | Tragic 54.0% |
| Kiowa | 0.0 /100 | #335 | Tragic 54.2% |
| Immigrants | Armenia | 0.0 /100 | #336 | Tragic 54.3% |
| Yuman | 0.0 /100 | #337 | Tragic 54.4% |
| Colville | 0.0 /100 | #338 | Tragic 55.4% |
| Pima | 0.0 /100 | #339 | Tragic 55.8% |
| Pueblo | 0.0 /100 | #340 | Tragic 55.9% |
| Houma | 0.0 /100 | #341 | Tragic 56.2% |
| Lumbee | 0.0 /100 | #342 | Tragic 56.2% |
| Tohono O'odham | 0.0 /100 | #343 | Tragic 56.7% |