Guatemalan vs Senegalese Disability Age 65 to 74
COMPARE
Guatemalan
Senegalese
Disability Age 65 to 74
Disability Age 65 to 74 Comparison
Guatemalans
Senegalese
25.5%
DISABILITY AGE 65 TO 74
0.2/ 100
METRIC RATING
265th/ 347
METRIC RANK
24.9%
DISABILITY AGE 65 TO 74
0.9/ 100
METRIC RATING
248th/ 347
METRIC RANK
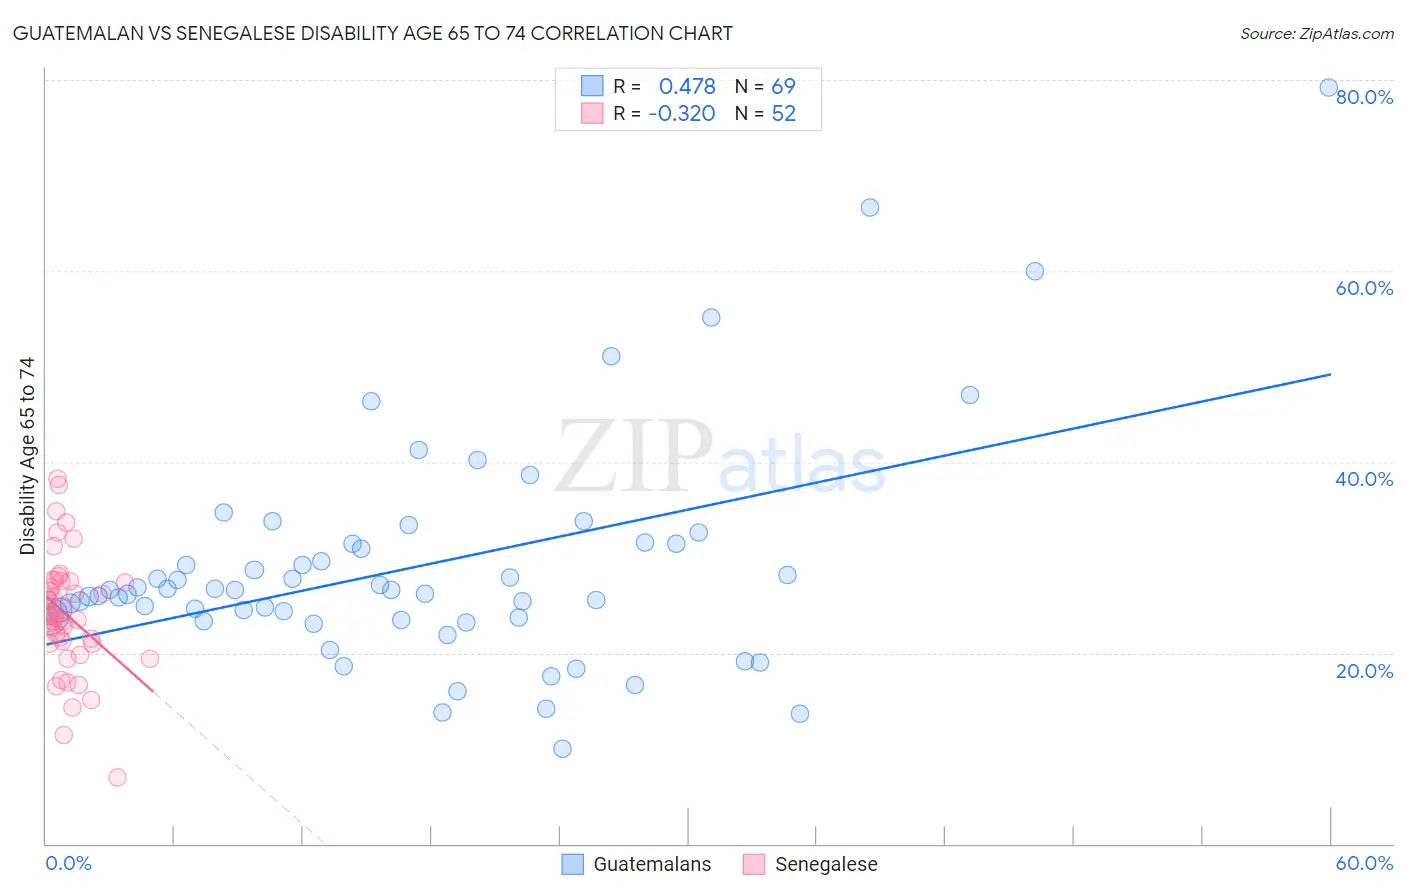
Guatemalan vs Senegalese Disability Age 65 to 74 Correlation Chart
The statistical analysis conducted on geographies consisting of 408,717,949 people shows a moderate positive correlation between the proportion of Guatemalans and percentage of population with a disability between the ages 65 and 75 in the United States with a correlation coefficient (R) of 0.478 and weighted average of 25.5%. Similarly, the statistical analysis conducted on geographies consisting of 78,090,599 people shows a mild negative correlation between the proportion of Senegalese and percentage of population with a disability between the ages 65 and 75 in the United States with a correlation coefficient (R) of -0.320 and weighted average of 24.9%, a difference of 2.4%.
Disability Age 65 to 74 Correlation Summary
| Measurement | Guatemalan | Senegalese |
| Minimum | 10.0% | 7.0% |
| Maximum | 79.2% | 38.2% |
| Range | 69.2% | 31.2% |
| Mean | 29.0% | 24.0% |
| Median | 26.6% | 23.9% |
| Interquartile 25% (IQ1) | 23.6% | 21.1% |
| Interquartile 75% (IQ3) | 31.4% | 27.4% |
| Interquartile Range (IQR) | 7.8% | 6.3% |
| Standard Deviation (Sample) | 11.9% | 6.0% |
| Standard Deviation (Population) | 11.9% | 6.0% |
Demographics Similar to Guatemalans and Senegalese by Disability Age 65 to 74
In terms of disability age 65 to 74, the demographic groups most similar to Guatemalans are Hawaiian (25.5%, a difference of 0.050%), Immigrants from Latin America (25.6%, a difference of 0.080%), Iroquois (25.4%, a difference of 0.39%), Samoan (25.4%, a difference of 0.40%), and Cape Verdean (25.4%, a difference of 0.49%). Similarly, the demographic groups most similar to Senegalese are Immigrants from Fiji (25.0%, a difference of 0.10%), Salvadoran (25.0%, a difference of 0.12%), Indonesian (24.9%, a difference of 0.25%), Nonimmigrants (25.0%, a difference of 0.32%), and Immigrants from El Salvador (25.1%, a difference of 0.51%).
| Demographics | Rating | Rank | Disability Age 65 to 74 |
| Immigrants | Iraq | 1.9 /100 | #246 | Tragic 24.7% |
| Indonesians | 1.1 /100 | #247 | Tragic 24.9% |
| Senegalese | 0.9 /100 | #248 | Tragic 24.9% |
| Immigrants | Fiji | 0.8 /100 | #249 | Tragic 25.0% |
| Salvadorans | 0.8 /100 | #250 | Tragic 25.0% |
| Immigrants | Nonimmigrants | 0.7 /100 | #251 | Tragic 25.0% |
| Immigrants | El Salvador | 0.6 /100 | #252 | Tragic 25.1% |
| Sub-Saharan Africans | 0.6 /100 | #253 | Tragic 25.1% |
| Somalis | 0.6 /100 | #254 | Tragic 25.1% |
| Central Americans | 0.5 /100 | #255 | Tragic 25.1% |
| Immigrants | Somalia | 0.4 /100 | #256 | Tragic 25.2% |
| Guamanians/Chamorros | 0.3 /100 | #257 | Tragic 25.3% |
| Marshallese | 0.3 /100 | #258 | Tragic 25.3% |
| Immigrants | Cambodia | 0.3 /100 | #259 | Tragic 25.3% |
| Malaysians | 0.2 /100 | #260 | Tragic 25.4% |
| Cape Verdeans | 0.2 /100 | #261 | Tragic 25.4% |
| Samoans | 0.2 /100 | #262 | Tragic 25.4% |
| Iroquois | 0.2 /100 | #263 | Tragic 25.4% |
| Hawaiians | 0.2 /100 | #264 | Tragic 25.5% |
| Guatemalans | 0.2 /100 | #265 | Tragic 25.5% |
| Immigrants | Latin America | 0.1 /100 | #266 | Tragic 25.6% |