Immigrants from Jordan vs Latvian Disability
COMPARE
Immigrants from Jordan
Latvian
Disability
Disability Comparison
Immigrants from Jordan
Latvians
11.1%
DISABILITY
99.3/ 100
METRIC RATING
79th/ 347
METRIC RANK
11.4%
DISABILITY
89.8/ 100
METRIC RATING
130th/ 347
METRIC RANK
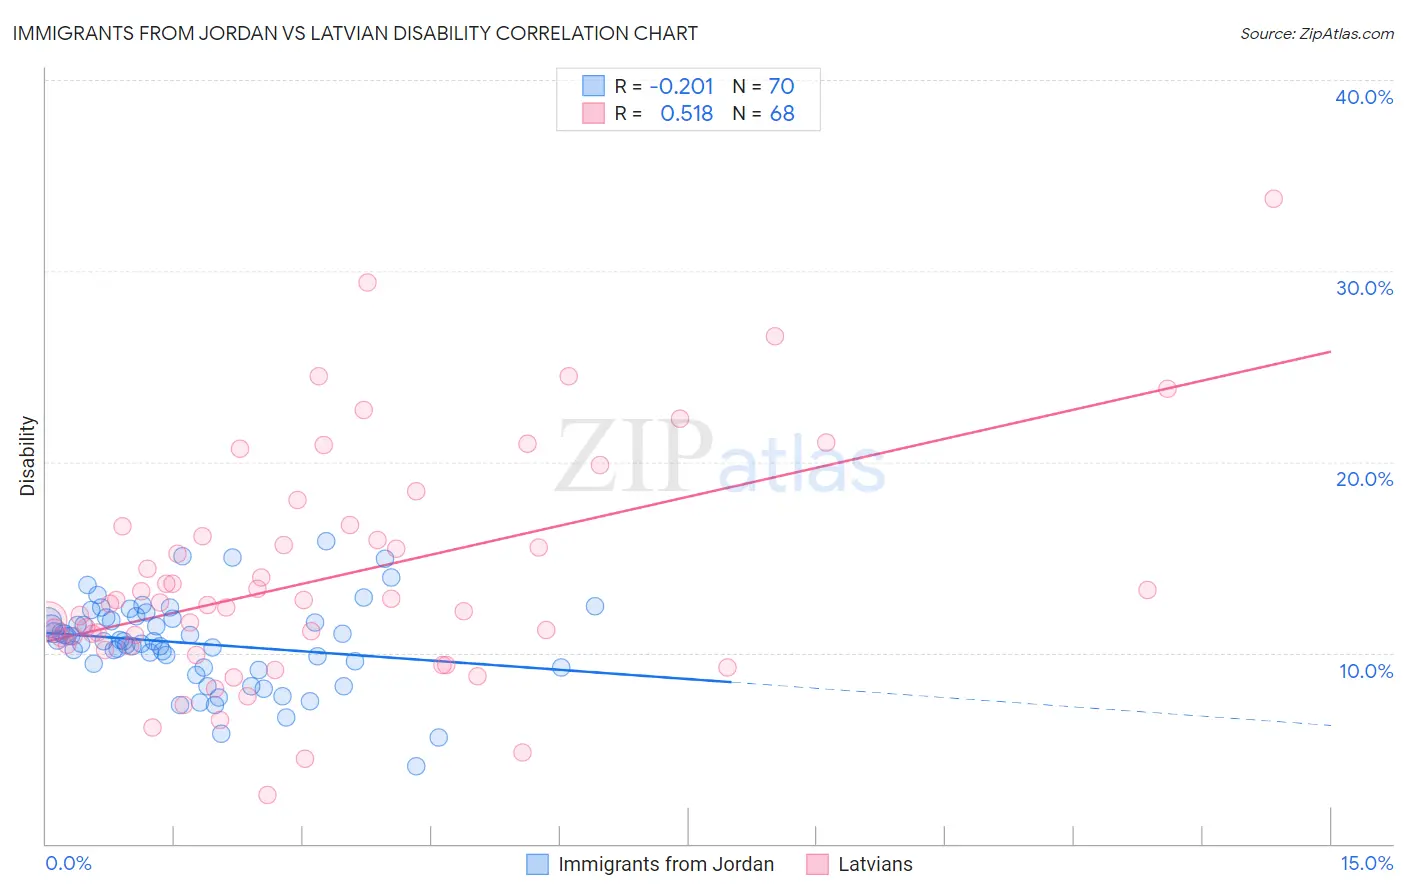
Immigrants from Jordan vs Latvian Disability Correlation Chart
The statistical analysis conducted on geographies consisting of 181,277,491 people shows a weak negative correlation between the proportion of Immigrants from Jordan and percentage of population with a disability in the United States with a correlation coefficient (R) of -0.201 and weighted average of 11.1%. Similarly, the statistical analysis conducted on geographies consisting of 220,718,032 people shows a substantial positive correlation between the proportion of Latvians and percentage of population with a disability in the United States with a correlation coefficient (R) of 0.518 and weighted average of 11.4%, a difference of 3.3%.
Disability Correlation Summary
| Measurement | Immigrants from Jordan | Latvian |
| Minimum | 4.0% | 2.6% |
| Maximum | 15.9% | 33.8% |
| Range | 11.8% | 31.2% |
| Mean | 10.5% | 13.9% |
| Median | 10.6% | 12.6% |
| Interquartile 25% (IQ1) | 9.2% | 10.4% |
| Interquartile 75% (IQ3) | 11.8% | 16.4% |
| Interquartile Range (IQR) | 2.5% | 6.0% |
| Standard Deviation (Sample) | 2.3% | 6.0% |
| Standard Deviation (Population) | 2.2% | 5.9% |
Similar Demographics by Disability
Demographics Similar to Immigrants from Jordan by Disability
In terms of disability, the demographic groups most similar to Immigrants from Jordan are Immigrants from Cameroon (11.1%, a difference of 0.040%), Immigrants from Ireland (11.1%, a difference of 0.050%), Immigrants from Belgium (11.0%, a difference of 0.070%), Sierra Leonean (11.0%, a difference of 0.080%), and Immigrants from Vietnam (11.0%, a difference of 0.10%).
| Demographics | Rating | Rank | Disability |
| Immigrants | Chile | 99.4 /100 | #72 | Exceptional 11.0% |
| Immigrants | Bangladesh | 99.4 /100 | #73 | Exceptional 11.0% |
| Immigrants | Serbia | 99.4 /100 | #74 | Exceptional 11.0% |
| Immigrants | Vietnam | 99.4 /100 | #75 | Exceptional 11.0% |
| Sierra Leoneans | 99.3 /100 | #76 | Exceptional 11.0% |
| Immigrants | Belgium | 99.3 /100 | #77 | Exceptional 11.0% |
| Immigrants | Cameroon | 99.3 /100 | #78 | Exceptional 11.1% |
| Immigrants | Jordan | 99.3 /100 | #79 | Exceptional 11.1% |
| Immigrants | Ireland | 99.3 /100 | #80 | Exceptional 11.1% |
| Immigrants | Poland | 99.1 /100 | #81 | Exceptional 11.1% |
| Chileans | 99.1 /100 | #82 | Exceptional 11.1% |
| Immigrants | Switzerland | 99.0 /100 | #83 | Exceptional 11.1% |
| Immigrants | Sierra Leone | 99.0 /100 | #84 | Exceptional 11.1% |
| Immigrants | Belarus | 98.9 /100 | #85 | Exceptional 11.1% |
| Immigrants | Russia | 98.9 /100 | #86 | Exceptional 11.1% |
Demographics Similar to Latvians by Disability
In terms of disability, the demographic groups most similar to Latvians are Immigrants from Croatia (11.4%, a difference of 0.010%), Macedonian (11.4%, a difference of 0.060%), Immigrants from Italy (11.4%, a difference of 0.070%), Immigrants from Europe (11.4%, a difference of 0.070%), and Immigrants from Africa (11.4%, a difference of 0.070%).
| Demographics | Rating | Rank | Disability |
| South Africans | 92.3 /100 | #123 | Exceptional 11.4% |
| South American Indians | 92.2 /100 | #124 | Exceptional 11.4% |
| Costa Ricans | 91.9 /100 | #125 | Exceptional 11.4% |
| Immigrants | Latvia | 90.9 /100 | #126 | Exceptional 11.4% |
| Immigrants | Italy | 90.4 /100 | #127 | Exceptional 11.4% |
| Immigrants | Europe | 90.4 /100 | #128 | Exceptional 11.4% |
| Macedonians | 90.3 /100 | #129 | Exceptional 11.4% |
| Latvians | 89.8 /100 | #130 | Excellent 11.4% |
| Immigrants | Croatia | 89.8 /100 | #131 | Excellent 11.4% |
| Immigrants | Africa | 89.3 /100 | #132 | Excellent 11.4% |
| Arabs | 89.1 /100 | #133 | Excellent 11.4% |
| Immigrants | Guyana | 88.3 /100 | #134 | Excellent 11.4% |
| Ugandans | 87.9 /100 | #135 | Excellent 11.4% |
| Immigrants | St. Vincent and the Grenadines | 87.8 /100 | #136 | Excellent 11.4% |
| Kenyans | 87.1 /100 | #137 | Excellent 11.5% |