Immigrants from Eritrea vs Latvian Disability
COMPARE
Immigrants from Eritrea
Latvian
Disability
Disability Comparison
Immigrants from Eritrea
Latvians
11.0%
DISABILITY
99.7/ 100
METRIC RATING
63rd/ 347
METRIC RANK
11.4%
DISABILITY
89.8/ 100
METRIC RATING
130th/ 347
METRIC RANK
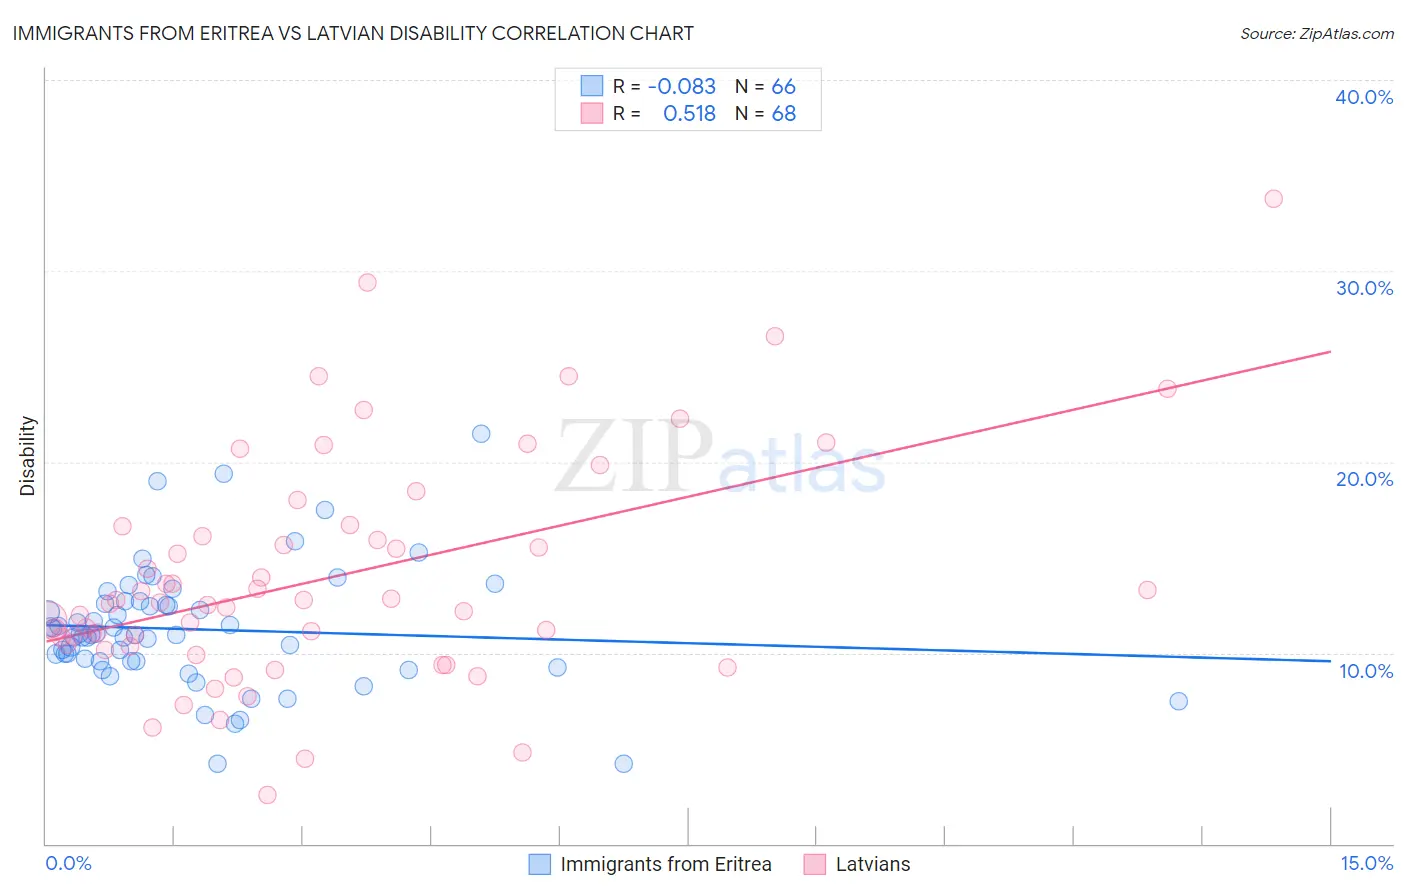
Immigrants from Eritrea vs Latvian Disability Correlation Chart
The statistical analysis conducted on geographies consisting of 104,852,788 people shows a slight negative correlation between the proportion of Immigrants from Eritrea and percentage of population with a disability in the United States with a correlation coefficient (R) of -0.083 and weighted average of 11.0%. Similarly, the statistical analysis conducted on geographies consisting of 220,718,032 people shows a substantial positive correlation between the proportion of Latvians and percentage of population with a disability in the United States with a correlation coefficient (R) of 0.518 and weighted average of 11.4%, a difference of 4.3%.
Disability Correlation Summary
| Measurement | Immigrants from Eritrea | Latvian |
| Minimum | 4.2% | 2.6% |
| Maximum | 21.4% | 33.8% |
| Range | 17.2% | 31.2% |
| Mean | 11.2% | 13.9% |
| Median | 10.9% | 12.6% |
| Interquartile 25% (IQ1) | 9.6% | 10.4% |
| Interquartile 75% (IQ3) | 12.6% | 16.4% |
| Interquartile Range (IQR) | 3.0% | 6.0% |
| Standard Deviation (Sample) | 3.2% | 6.0% |
| Standard Deviation (Population) | 3.1% | 5.9% |
Similar Demographics by Disability
Demographics Similar to Immigrants from Eritrea by Disability
In terms of disability, the demographic groups most similar to Immigrants from Eritrea are Immigrants from Northern Africa (10.9%, a difference of 0.020%), Immigrants from Bulgaria (10.9%, a difference of 0.060%), Zimbabwean (10.9%, a difference of 0.11%), Immigrants from Sweden (11.0%, a difference of 0.18%), and Bulgarian (11.0%, a difference of 0.20%).
| Demographics | Rating | Rank | Disability |
| Immigrants | Lithuania | 99.8 /100 | #56 | Exceptional 10.9% |
| Salvadorans | 99.8 /100 | #57 | Exceptional 10.9% |
| Immigrants | South America | 99.8 /100 | #58 | Exceptional 10.9% |
| Immigrants | Colombia | 99.7 /100 | #59 | Exceptional 10.9% |
| Zimbabweans | 99.7 /100 | #60 | Exceptional 10.9% |
| Immigrants | Bulgaria | 99.7 /100 | #61 | Exceptional 10.9% |
| Immigrants | Northern Africa | 99.7 /100 | #62 | Exceptional 10.9% |
| Immigrants | Eritrea | 99.7 /100 | #63 | Exceptional 11.0% |
| Immigrants | Sweden | 99.6 /100 | #64 | Exceptional 11.0% |
| Bulgarians | 99.6 /100 | #65 | Exceptional 11.0% |
| Laotians | 99.6 /100 | #66 | Exceptional 11.0% |
| Colombians | 99.6 /100 | #67 | Exceptional 11.0% |
| Immigrants | Afghanistan | 99.6 /100 | #68 | Exceptional 11.0% |
| Sri Lankans | 99.5 /100 | #69 | Exceptional 11.0% |
| Immigrants | France | 99.4 /100 | #70 | Exceptional 11.0% |
Demographics Similar to Latvians by Disability
In terms of disability, the demographic groups most similar to Latvians are Immigrants from Croatia (11.4%, a difference of 0.010%), Macedonian (11.4%, a difference of 0.060%), Immigrants from Italy (11.4%, a difference of 0.070%), Immigrants from Europe (11.4%, a difference of 0.070%), and Immigrants from Africa (11.4%, a difference of 0.070%).
| Demographics | Rating | Rank | Disability |
| South Africans | 92.3 /100 | #123 | Exceptional 11.4% |
| South American Indians | 92.2 /100 | #124 | Exceptional 11.4% |
| Costa Ricans | 91.9 /100 | #125 | Exceptional 11.4% |
| Immigrants | Latvia | 90.9 /100 | #126 | Exceptional 11.4% |
| Immigrants | Italy | 90.4 /100 | #127 | Exceptional 11.4% |
| Immigrants | Europe | 90.4 /100 | #128 | Exceptional 11.4% |
| Macedonians | 90.3 /100 | #129 | Exceptional 11.4% |
| Latvians | 89.8 /100 | #130 | Excellent 11.4% |
| Immigrants | Croatia | 89.8 /100 | #131 | Excellent 11.4% |
| Immigrants | Africa | 89.3 /100 | #132 | Excellent 11.4% |
| Arabs | 89.1 /100 | #133 | Excellent 11.4% |
| Immigrants | Guyana | 88.3 /100 | #134 | Excellent 11.4% |
| Ugandans | 87.9 /100 | #135 | Excellent 11.4% |
| Immigrants | St. Vincent and the Grenadines | 87.8 /100 | #136 | Excellent 11.4% |
| Kenyans | 87.1 /100 | #137 | Excellent 11.5% |