Chinese vs Immigrants from Liberia Disability Age Over 75
COMPARE
Chinese
Immigrants from Liberia
Disability Age Over 75
Disability Age Over 75 Comparison
Chinese
Immigrants from Liberia
48.7%
DISABILITY AGE OVER 75
0.5/ 100
METRIC RATING
255th/ 347
METRIC RANK
48.1%
DISABILITY AGE OVER 75
5.9/ 100
METRIC RATING
228th/ 347
METRIC RANK
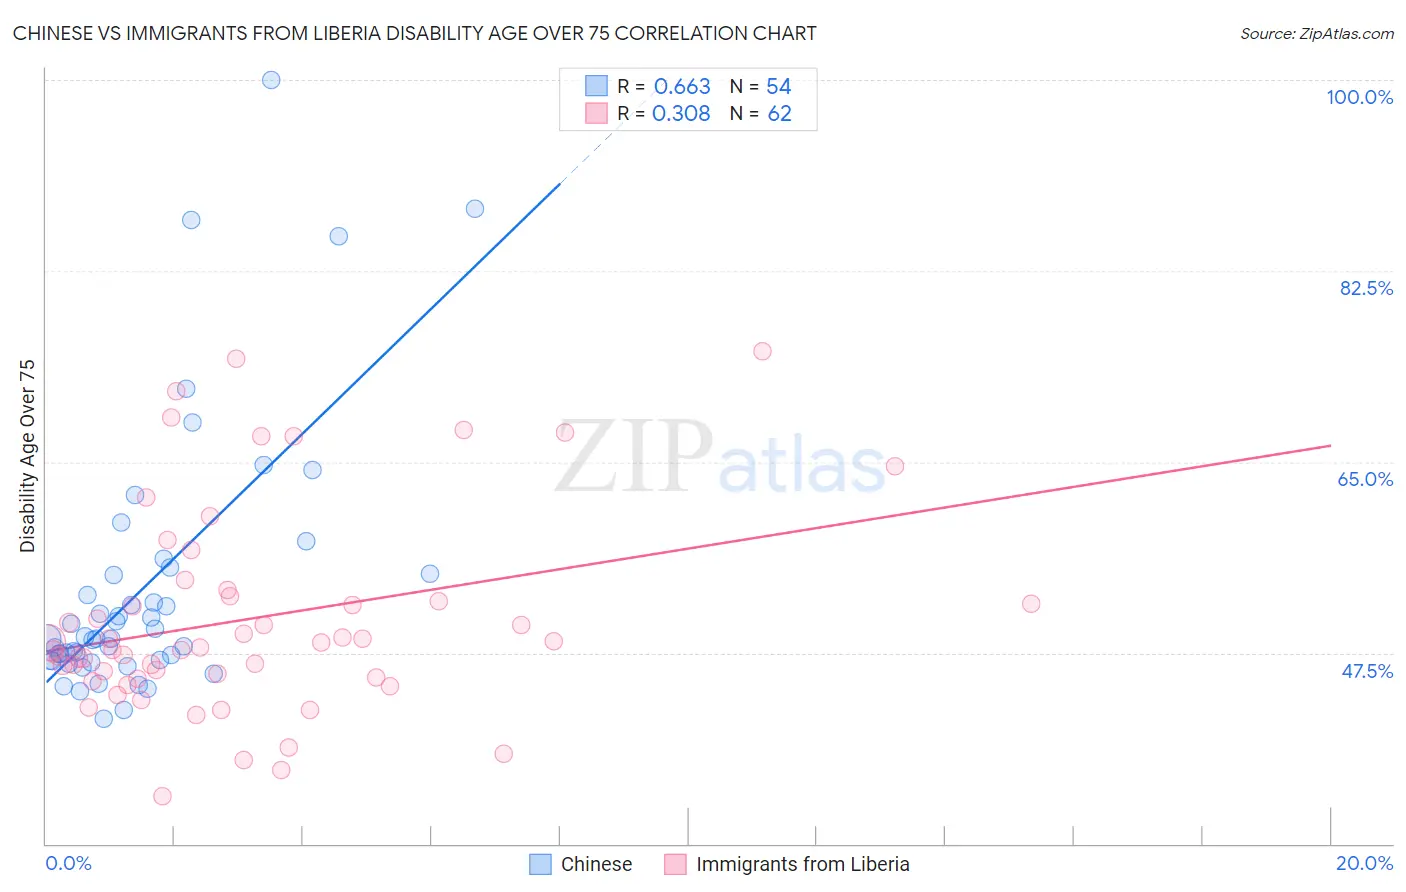
Chinese vs Immigrants from Liberia Disability Age Over 75 Correlation Chart
The statistical analysis conducted on geographies consisting of 64,754,730 people shows a significant positive correlation between the proportion of Chinese and percentage of population with a disability over the age of 75 in the United States with a correlation coefficient (R) of 0.663 and weighted average of 48.7%. Similarly, the statistical analysis conducted on geographies consisting of 135,085,224 people shows a mild positive correlation between the proportion of Immigrants from Liberia and percentage of population with a disability over the age of 75 in the United States with a correlation coefficient (R) of 0.308 and weighted average of 48.1%, a difference of 1.4%.
Disability Age Over 75 Correlation Summary
| Measurement | Chinese | Immigrants from Liberia |
| Minimum | 41.4% | 34.4% |
| Maximum | 100.0% | 75.1% |
| Range | 58.6% | 40.7% |
| Mean | 53.5% | 50.7% |
| Median | 48.8% | 48.2% |
| Interquartile 25% (IQ1) | 46.8% | 45.3% |
| Interquartile 75% (IQ3) | 54.8% | 52.7% |
| Interquartile Range (IQR) | 8.0% | 7.4% |
| Standard Deviation (Sample) | 12.3% | 9.4% |
| Standard Deviation (Population) | 12.2% | 9.3% |
Similar Demographics by Disability Age Over 75
Demographics Similar to Chinese by Disability Age Over 75
In terms of disability age over 75, the demographic groups most similar to Chinese are Immigrants from Congo (48.7%, a difference of 0.010%), Immigrants from Vietnam (48.7%, a difference of 0.040%), Blackfeet (48.8%, a difference of 0.060%), British West Indian (48.7%, a difference of 0.070%), and Immigrants from Philippines (48.8%, a difference of 0.10%).
| Demographics | Rating | Rank | Disability Age Over 75 |
| Sri Lankans | 1.4 /100 | #248 | Tragic 48.5% |
| Iraqis | 1.0 /100 | #249 | Tragic 48.6% |
| West Indians | 0.8 /100 | #250 | Tragic 48.6% |
| Koreans | 0.8 /100 | #251 | Tragic 48.6% |
| Immigrants | South Eastern Asia | 0.7 /100 | #252 | Tragic 48.7% |
| British West Indians | 0.6 /100 | #253 | Tragic 48.7% |
| Immigrants | Vietnam | 0.6 /100 | #254 | Tragic 48.7% |
| Chinese | 0.5 /100 | #255 | Tragic 48.7% |
| Immigrants | Congo | 0.5 /100 | #256 | Tragic 48.7% |
| Blackfeet | 0.5 /100 | #257 | Tragic 48.8% |
| Immigrants | Philippines | 0.4 /100 | #258 | Tragic 48.8% |
| Central Americans | 0.4 /100 | #259 | Tragic 48.8% |
| Immigrants | Afghanistan | 0.4 /100 | #260 | Tragic 48.8% |
| Africans | 0.3 /100 | #261 | Tragic 48.9% |
| Immigrants | West Indies | 0.3 /100 | #262 | Tragic 48.9% |
Demographics Similar to Immigrants from Liberia by Disability Age Over 75
In terms of disability age over 75, the demographic groups most similar to Immigrants from Liberia are Spaniard (48.1%, a difference of 0.020%), Zimbabwean (48.1%, a difference of 0.040%), Nonimmigrants (48.0%, a difference of 0.050%), Spanish (48.0%, a difference of 0.060%), and Liberian (48.0%, a difference of 0.070%).
| Demographics | Rating | Rank | Disability Age Over 75 |
| Immigrants | Oceania | 7.3 /100 | #221 | Tragic 48.0% |
| Barbadians | 6.8 /100 | #222 | Tragic 48.0% |
| Immigrants | Bangladesh | 6.8 /100 | #223 | Tragic 48.0% |
| Liberians | 6.7 /100 | #224 | Tragic 48.0% |
| Spanish | 6.5 /100 | #225 | Tragic 48.0% |
| Immigrants | Nonimmigrants | 6.5 /100 | #226 | Tragic 48.0% |
| Zimbabweans | 6.4 /100 | #227 | Tragic 48.1% |
| Immigrants | Liberia | 5.9 /100 | #228 | Tragic 48.1% |
| Spaniards | 5.7 /100 | #229 | Tragic 48.1% |
| Taiwanese | 4.4 /100 | #230 | Tragic 48.2% |
| Immigrants | Immigrants | 4.3 /100 | #231 | Tragic 48.2% |
| Indonesians | 4.2 /100 | #232 | Tragic 48.2% |
| Cree | 4.2 /100 | #233 | Tragic 48.2% |
| Sub-Saharan Africans | 3.8 /100 | #234 | Tragic 48.2% |
| Hmong | 3.8 /100 | #235 | Tragic 48.2% |