Czechoslovakian vs Immigrants from Liberia Disability Age Over 75
COMPARE
Czechoslovakian
Immigrants from Liberia
Disability Age Over 75
Disability Age Over 75 Comparison
Czechoslovakians
Immigrants from Liberia
46.6%
DISABILITY AGE OVER 75
94.7/ 100
METRIC RATING
118th/ 347
METRIC RANK
48.1%
DISABILITY AGE OVER 75
5.9/ 100
METRIC RATING
228th/ 347
METRIC RANK
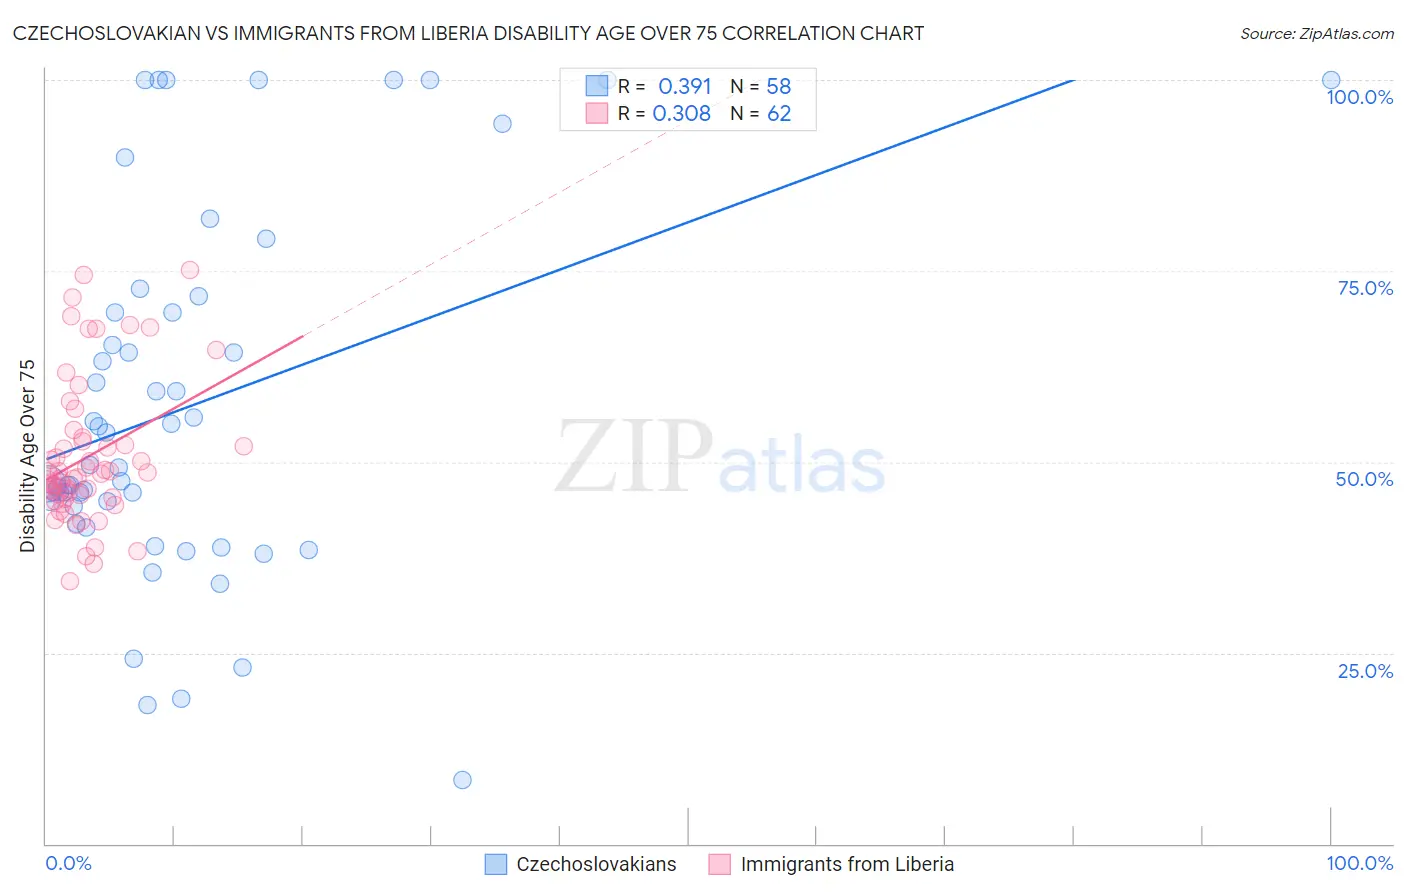
Czechoslovakian vs Immigrants from Liberia Disability Age Over 75 Correlation Chart
The statistical analysis conducted on geographies consisting of 368,266,748 people shows a mild positive correlation between the proportion of Czechoslovakians and percentage of population with a disability over the age of 75 in the United States with a correlation coefficient (R) of 0.391 and weighted average of 46.6%. Similarly, the statistical analysis conducted on geographies consisting of 135,085,224 people shows a mild positive correlation between the proportion of Immigrants from Liberia and percentage of population with a disability over the age of 75 in the United States with a correlation coefficient (R) of 0.308 and weighted average of 48.1%, a difference of 3.2%.
Disability Age Over 75 Correlation Summary
| Measurement | Czechoslovakian | Immigrants from Liberia |
| Minimum | 8.3% | 34.4% |
| Maximum | 100.0% | 75.1% |
| Range | 91.7% | 40.7% |
| Mean | 57.3% | 50.7% |
| Median | 49.4% | 48.2% |
| Interquartile 25% (IQ1) | 44.1% | 45.3% |
| Interquartile 75% (IQ3) | 69.6% | 52.7% |
| Interquartile Range (IQR) | 25.5% | 7.4% |
| Standard Deviation (Sample) | 23.7% | 9.4% |
| Standard Deviation (Population) | 23.5% | 9.3% |
Similar Demographics by Disability Age Over 75
Demographics Similar to Czechoslovakians by Disability Age Over 75
In terms of disability age over 75, the demographic groups most similar to Czechoslovakians are Canadian (46.6%, a difference of 0.030%), Immigrants from Nepal (46.6%, a difference of 0.060%), Hungarian (46.5%, a difference of 0.080%), Scandinavian (46.6%, a difference of 0.10%), and Indian (Asian) (46.5%, a difference of 0.13%).
| Demographics | Rating | Rank | Disability Age Over 75 |
| Immigrants | Chile | 96.4 /100 | #111 | Exceptional 46.5% |
| Immigrants | Pakistan | 96.1 /100 | #112 | Exceptional 46.5% |
| Irish | 96.0 /100 | #113 | Exceptional 46.5% |
| Dutch | 95.9 /100 | #114 | Exceptional 46.5% |
| British | 95.7 /100 | #115 | Exceptional 46.5% |
| Indians (Asian) | 95.7 /100 | #116 | Exceptional 46.5% |
| Hungarians | 95.3 /100 | #117 | Exceptional 46.5% |
| Czechoslovakians | 94.7 /100 | #118 | Exceptional 46.6% |
| Canadians | 94.4 /100 | #119 | Exceptional 46.6% |
| Immigrants | Nepal | 94.1 /100 | #120 | Exceptional 46.6% |
| Scandinavians | 93.6 /100 | #121 | Exceptional 46.6% |
| Immigrants | Albania | 93.2 /100 | #122 | Exceptional 46.6% |
| Immigrants | Colombia | 92.6 /100 | #123 | Exceptional 46.7% |
| Immigrants | South America | 91.8 /100 | #124 | Exceptional 46.7% |
| Colombians | 91.3 /100 | #125 | Exceptional 46.7% |
Demographics Similar to Immigrants from Liberia by Disability Age Over 75
In terms of disability age over 75, the demographic groups most similar to Immigrants from Liberia are Spaniard (48.1%, a difference of 0.020%), Zimbabwean (48.1%, a difference of 0.040%), Nonimmigrants (48.0%, a difference of 0.050%), Spanish (48.0%, a difference of 0.060%), and Liberian (48.0%, a difference of 0.070%).
| Demographics | Rating | Rank | Disability Age Over 75 |
| Immigrants | Oceania | 7.3 /100 | #221 | Tragic 48.0% |
| Barbadians | 6.8 /100 | #222 | Tragic 48.0% |
| Immigrants | Bangladesh | 6.8 /100 | #223 | Tragic 48.0% |
| Liberians | 6.7 /100 | #224 | Tragic 48.0% |
| Spanish | 6.5 /100 | #225 | Tragic 48.0% |
| Immigrants | Nonimmigrants | 6.5 /100 | #226 | Tragic 48.0% |
| Zimbabweans | 6.4 /100 | #227 | Tragic 48.1% |
| Immigrants | Liberia | 5.9 /100 | #228 | Tragic 48.1% |
| Spaniards | 5.7 /100 | #229 | Tragic 48.1% |
| Taiwanese | 4.4 /100 | #230 | Tragic 48.2% |
| Immigrants | Immigrants | 4.3 /100 | #231 | Tragic 48.2% |
| Indonesians | 4.2 /100 | #232 | Tragic 48.2% |
| Cree | 4.2 /100 | #233 | Tragic 48.2% |
| Sub-Saharan Africans | 3.8 /100 | #234 | Tragic 48.2% |
| Hmong | 3.8 /100 | #235 | Tragic 48.2% |