Laotian vs English Disability Age 65 to 74
COMPARE
Laotian
English
Disability Age 65 to 74
Disability Age 65 to 74 Comparison
Laotians
English
22.3%
DISABILITY AGE 65 TO 74
94.9/ 100
METRIC RATING
115th/ 347
METRIC RANK
23.6%
DISABILITY AGE 65 TO 74
28.5/ 100
METRIC RATING
193rd/ 347
METRIC RANK
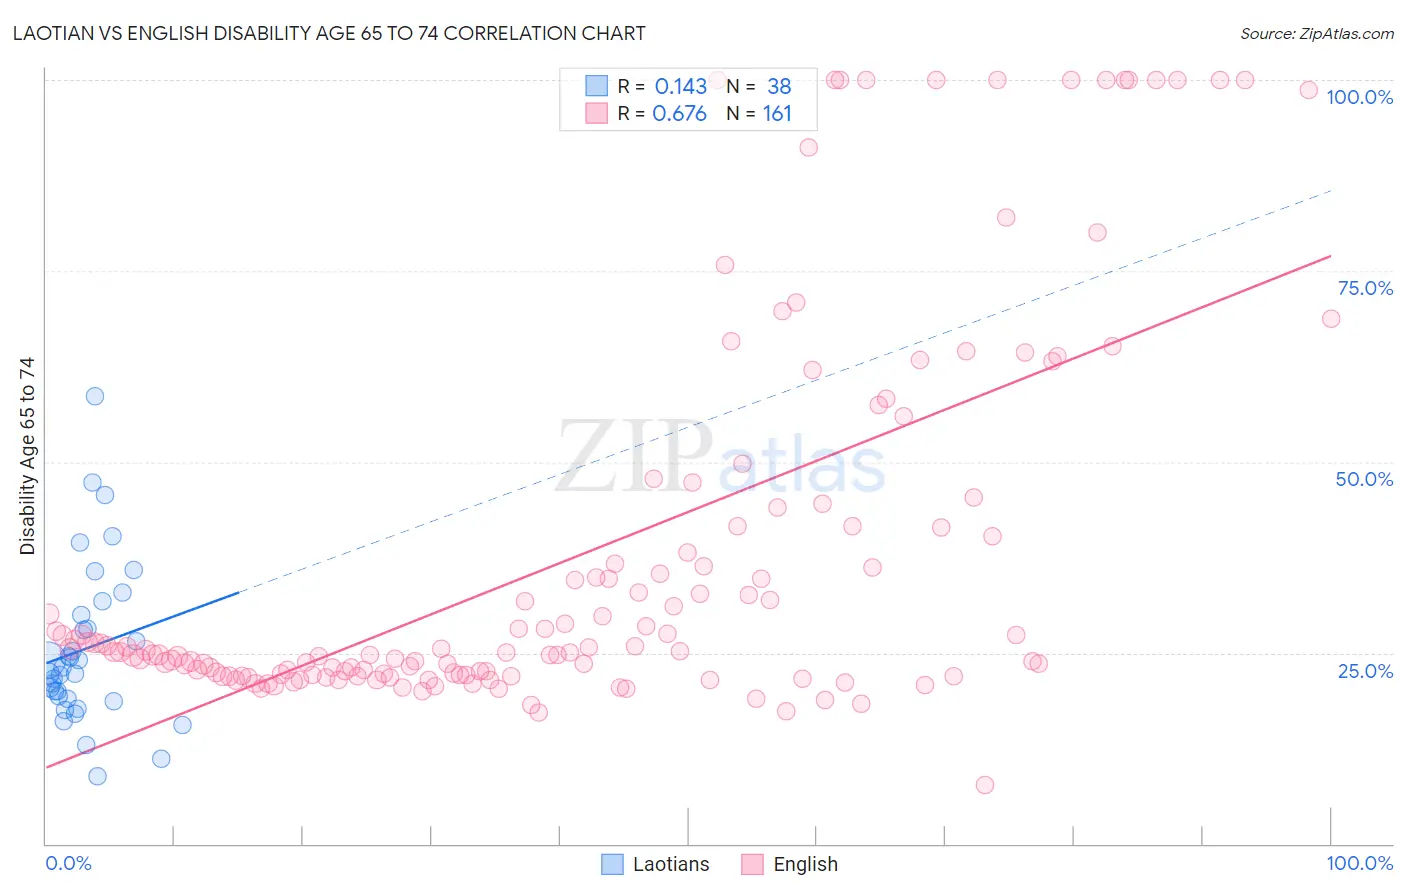
Laotian vs English Disability Age 65 to 74 Correlation Chart
The statistical analysis conducted on geographies consisting of 224,537,885 people shows a poor positive correlation between the proportion of Laotians and percentage of population with a disability between the ages 65 and 75 in the United States with a correlation coefficient (R) of 0.143 and weighted average of 22.3%. Similarly, the statistical analysis conducted on geographies consisting of 576,788,305 people shows a significant positive correlation between the proportion of English and percentage of population with a disability between the ages 65 and 75 in the United States with a correlation coefficient (R) of 0.676 and weighted average of 23.6%, a difference of 5.8%.
Disability Age 65 to 74 Correlation Summary
| Measurement | Laotian | English |
| Minimum | 8.9% | 7.7% |
| Maximum | 58.7% | 100.0% |
| Range | 49.8% | 92.3% |
| Mean | 25.5% | 37.7% |
| Median | 22.7% | 25.2% |
| Interquartile 25% (IQ1) | 19.0% | 22.1% |
| Interquartile 75% (IQ3) | 29.9% | 41.6% |
| Interquartile Range (IQR) | 10.9% | 19.4% |
| Standard Deviation (Sample) | 10.5% | 24.9% |
| Standard Deviation (Population) | 10.3% | 24.8% |
Similar Demographics by Disability Age 65 to 74
Demographics Similar to Laotians by Disability Age 65 to 74
In terms of disability age 65 to 74, the demographic groups most similar to Laotians are Brazilian (22.4%, a difference of 0.040%), Swedish (22.4%, a difference of 0.050%), Ukrainian (22.3%, a difference of 0.060%), Austrian (22.4%, a difference of 0.060%), and Immigrants from Northern Africa (22.4%, a difference of 0.060%).
| Demographics | Rating | Rank | Disability Age 65 to 74 |
| Immigrants | Zimbabwe | 96.1 /100 | #108 | Exceptional 22.3% |
| Albanians | 95.8 /100 | #109 | Exceptional 22.3% |
| Immigrants | Peru | 95.7 /100 | #110 | Exceptional 22.3% |
| Serbians | 95.7 /100 | #111 | Exceptional 22.3% |
| Immigrants | South America | 95.5 /100 | #112 | Exceptional 22.3% |
| Syrians | 95.3 /100 | #113 | Exceptional 22.3% |
| Ukrainians | 95.1 /100 | #114 | Exceptional 22.3% |
| Laotians | 94.9 /100 | #115 | Exceptional 22.3% |
| Brazilians | 94.8 /100 | #116 | Exceptional 22.4% |
| Swedes | 94.7 /100 | #117 | Exceptional 22.4% |
| Austrians | 94.7 /100 | #118 | Exceptional 22.4% |
| Immigrants | Northern Africa | 94.7 /100 | #119 | Exceptional 22.4% |
| Immigrants | Kazakhstan | 93.9 /100 | #120 | Exceptional 22.4% |
| Czechs | 93.5 /100 | #121 | Exceptional 22.4% |
| Immigrants | Jordan | 93.5 /100 | #122 | Exceptional 22.4% |
Demographics Similar to English by Disability Age 65 to 74
In terms of disability age 65 to 74, the demographic groups most similar to English are Sudanese (23.7%, a difference of 0.050%), Ecuadorian (23.6%, a difference of 0.080%), Immigrants from Bangladesh (23.6%, a difference of 0.12%), Immigrants from St. Vincent and the Grenadines (23.7%, a difference of 0.18%), and Immigrants from Trinidad and Tobago (23.7%, a difference of 0.18%).
| Demographics | Rating | Rank | Disability Age 65 to 74 |
| Basques | 38.4 /100 | #186 | Fair 23.5% |
| Portuguese | 37.8 /100 | #187 | Fair 23.5% |
| Immigrants | Cuba | 34.0 /100 | #188 | Fair 23.6% |
| Scottish | 33.1 /100 | #189 | Fair 23.6% |
| Immigrants | Guyana | 31.2 /100 | #190 | Fair 23.6% |
| Immigrants | Bangladesh | 30.2 /100 | #191 | Fair 23.6% |
| Ecuadorians | 29.7 /100 | #192 | Fair 23.6% |
| English | 28.5 /100 | #193 | Fair 23.6% |
| Sudanese | 27.8 /100 | #194 | Fair 23.7% |
| Immigrants | St. Vincent and the Grenadines | 26.1 /100 | #195 | Fair 23.7% |
| Immigrants | Trinidad and Tobago | 26.1 /100 | #196 | Fair 23.7% |
| Immigrants | Immigrants | 25.8 /100 | #197 | Fair 23.7% |
| Immigrants | Africa | 24.4 /100 | #198 | Fair 23.7% |
| Welsh | 24.3 /100 | #199 | Fair 23.7% |
| French Canadians | 24.0 /100 | #200 | Fair 23.7% |