Yup'ik vs Cherokee Unemployment Among Ages 16 to 19 years
COMPARE
Yup'ik
Cherokee
Unemployment Among Ages 16 to 19 years
Unemployment Among Ages 16 to 19 years Comparison
Yup'ik
Cherokee
41.0%
UNEMPLOYMENT AMONG AGES 16 TO 19 YEARS
0.0/ 100
METRIC RATING
347th/ 347
METRIC RANK
17.9%
UNEMPLOYMENT AMONG AGES 16 TO 19 YEARS
15.7/ 100
METRIC RATING
209th/ 347
METRIC RANK
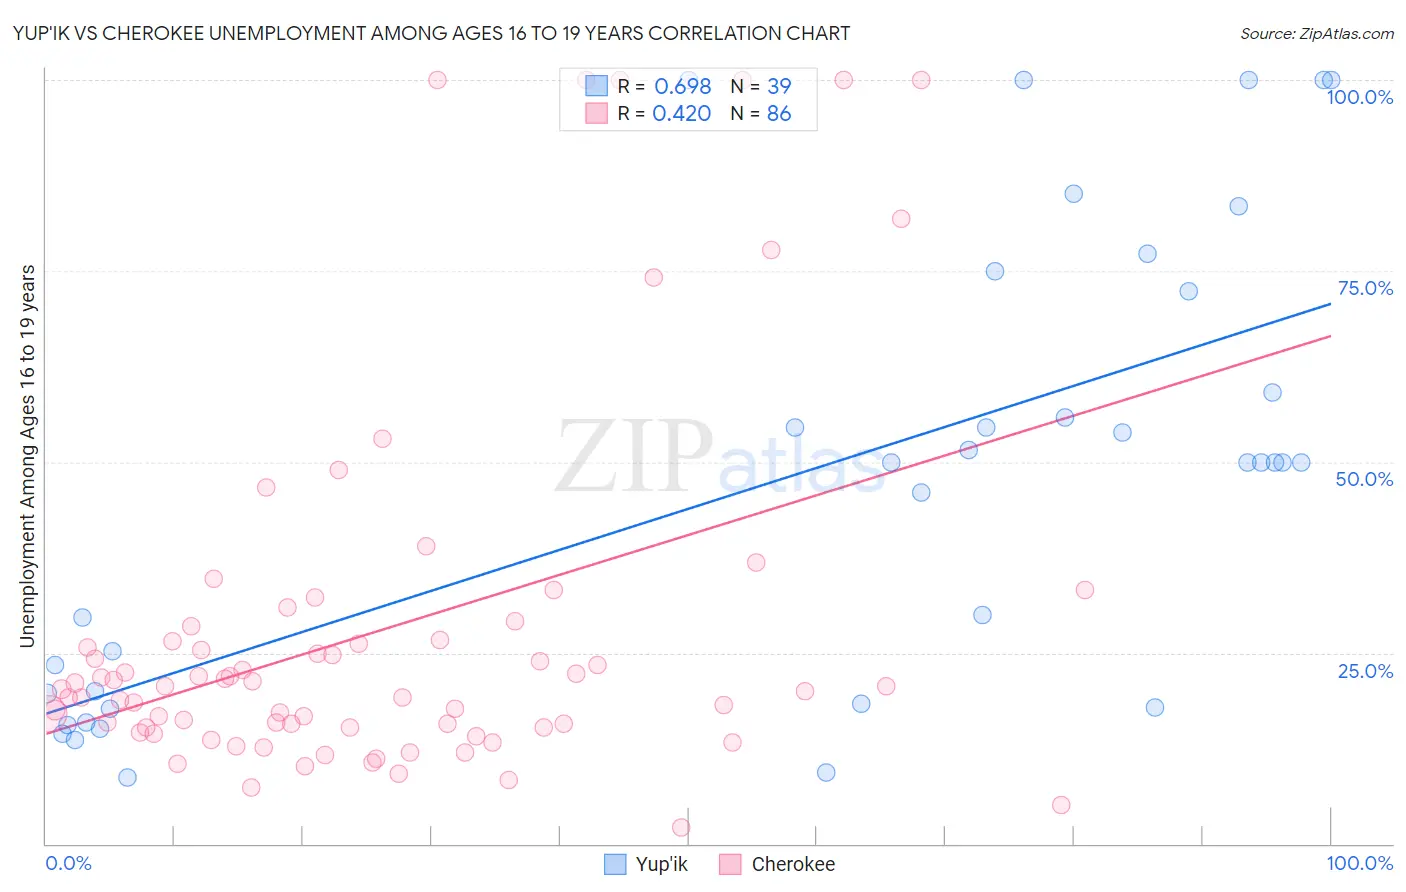
Yup'ik vs Cherokee Unemployment Among Ages 16 to 19 years Correlation Chart
The statistical analysis conducted on geographies consisting of 39,366,389 people shows a significant positive correlation between the proportion of Yup'ik and unemployment rate among population between the ages 16 and 19 in the United States with a correlation coefficient (R) of 0.698 and weighted average of 41.0%. Similarly, the statistical analysis conducted on geographies consisting of 455,329,369 people shows a moderate positive correlation between the proportion of Cherokee and unemployment rate among population between the ages 16 and 19 in the United States with a correlation coefficient (R) of 0.420 and weighted average of 17.9%, a difference of 128.6%.
Unemployment Among Ages 16 to 19 years Correlation Summary
| Measurement | Yup'ik | Cherokee |
| Minimum | 8.7% | 2.2% |
| Maximum | 100.0% | 100.0% |
| Range | 91.3% | 97.8% |
| Mean | 47.8% | 28.0% |
| Median | 50.0% | 20.4% |
| Interquartile 25% (IQ1) | 18.4% | 15.2% |
| Interquartile 75% (IQ3) | 72.3% | 26.7% |
| Interquartile Range (IQR) | 53.9% | 11.5% |
| Standard Deviation (Sample) | 29.6% | 24.2% |
| Standard Deviation (Population) | 29.2% | 24.0% |
Similar Demographics by Unemployment Among Ages 16 to 19 years
Demographics Similar to Yup'ik by Unemployment Among Ages 16 to 19 years
In terms of unemployment among ages 16 to 19 years, the demographic groups most similar to Yup'ik are Yuman (37.4%, a difference of 9.5%), Hopi (30.7%, a difference of 33.6%), Colville (29.7%, a difference of 38.1%), Navajo (29.0%, a difference of 41.1%), and Inupiat (28.1%, a difference of 46.0%).
| Demographics | Rating | Rank | Unemployment Among Ages 16 to 19 years |
| Paiute | 0.0 /100 | #333 | Tragic 24.4% |
| Guyanese | 0.0 /100 | #334 | Tragic 24.8% |
| Arapaho | 0.0 /100 | #335 | Tragic 25.2% |
| Kiowa | 0.0 /100 | #336 | Tragic 25.2% |
| Immigrants | Guyana | 0.0 /100 | #337 | Tragic 25.5% |
| Immigrants | St. Vincent and the Grenadines | 0.0 /100 | #338 | Tragic 25.7% |
| Immigrants | Grenada | 0.0 /100 | #339 | Tragic 25.7% |
| Crow | 0.0 /100 | #340 | Tragic 26.2% |
| Puerto Ricans | 0.0 /100 | #341 | Tragic 27.5% |
| Inupiat | 0.0 /100 | #342 | Tragic 28.1% |
| Navajo | 0.0 /100 | #343 | Tragic 29.0% |
| Colville | 0.0 /100 | #344 | Tragic 29.7% |
| Hopi | 0.0 /100 | #345 | Tragic 30.7% |
| Yuman | 0.0 /100 | #346 | Tragic 37.4% |
| Yup'ik | 0.0 /100 | #347 | Tragic 41.0% |
Demographics Similar to Cherokee by Unemployment Among Ages 16 to 19 years
In terms of unemployment among ages 16 to 19 years, the demographic groups most similar to Cherokee are Carpatho Rusyn (17.9%, a difference of 0.010%), Hawaiian (17.9%, a difference of 0.090%), Guamanian/Chamorro (17.9%, a difference of 0.12%), Argentinean (18.0%, a difference of 0.17%), and Chippewa (18.0%, a difference of 0.18%).
| Demographics | Rating | Rank | Unemployment Among Ages 16 to 19 years |
| Immigrants | Portugal | 27.2 /100 | #202 | Fair 17.8% |
| Immigrants | Eastern Europe | 23.6 /100 | #203 | Fair 17.8% |
| Immigrants | Nonimmigrants | 20.9 /100 | #204 | Fair 17.9% |
| Assyrians/Chaldeans/Syriacs | 20.8 /100 | #205 | Fair 17.9% |
| Immigrants | Southern Europe | 18.9 /100 | #206 | Poor 17.9% |
| Liberians | 18.6 /100 | #207 | Poor 17.9% |
| Hawaiians | 16.8 /100 | #208 | Poor 17.9% |
| Cherokee | 15.7 /100 | #209 | Poor 17.9% |
| Carpatho Rusyns | 15.6 /100 | #210 | Poor 17.9% |
| Guamanians/Chamorros | 14.5 /100 | #211 | Poor 17.9% |
| Argentineans | 13.8 /100 | #212 | Poor 18.0% |
| Chippewa | 13.7 /100 | #213 | Poor 18.0% |
| Immigrants | Morocco | 13.5 /100 | #214 | Poor 18.0% |
| Immigrants | Syria | 13.3 /100 | #215 | Poor 18.0% |
| Immigrants | Kazakhstan | 13.0 /100 | #216 | Poor 18.0% |