Immigrants from Venezuela vs Cherokee Disability Age 65 to 74
COMPARE
Immigrants from Venezuela
Cherokee
Disability Age 65 to 74
Disability Age 65 to 74 Comparison
Immigrants from Venezuela
Cherokee
21.8%
DISABILITY AGE 65 TO 74
99.0/ 100
METRIC RATING
73rd/ 347
METRIC RANK
28.2%
DISABILITY AGE 65 TO 74
0.0/ 100
METRIC RATING
320th/ 347
METRIC RANK
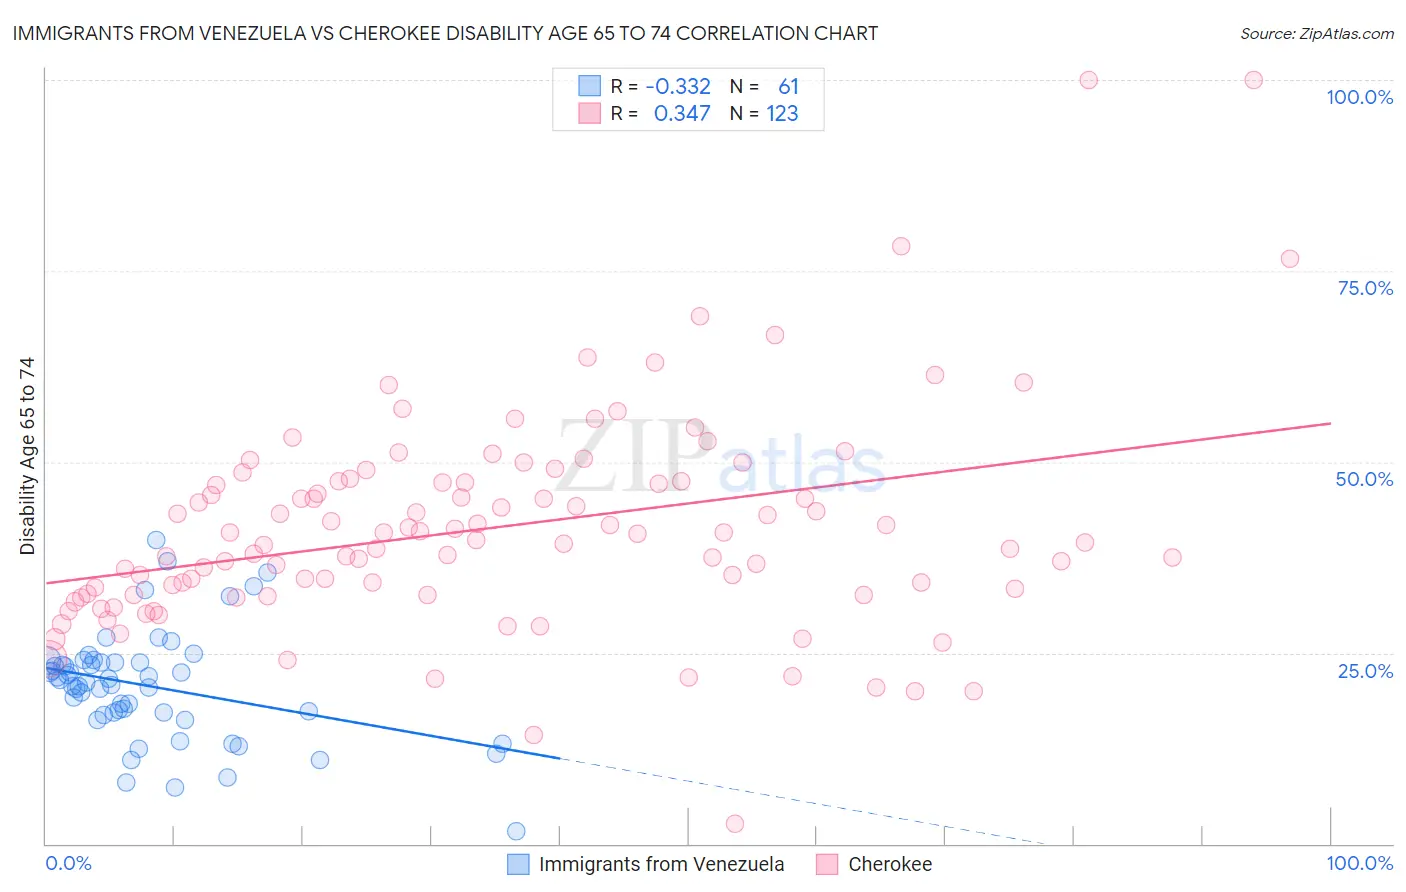
Immigrants from Venezuela vs Cherokee Disability Age 65 to 74 Correlation Chart
The statistical analysis conducted on geographies consisting of 287,548,772 people shows a mild negative correlation between the proportion of Immigrants from Venezuela and percentage of population with a disability between the ages 65 and 75 in the United States with a correlation coefficient (R) of -0.332 and weighted average of 21.8%. Similarly, the statistical analysis conducted on geographies consisting of 492,470,212 people shows a mild positive correlation between the proportion of Cherokee and percentage of population with a disability between the ages 65 and 75 in the United States with a correlation coefficient (R) of 0.347 and weighted average of 28.2%, a difference of 29.6%.
Disability Age 65 to 74 Correlation Summary
| Measurement | Immigrants from Venezuela | Cherokee |
| Minimum | 1.6% | 2.6% |
| Maximum | 39.7% | 100.0% |
| Range | 38.1% | 97.4% |
| Mean | 20.6% | 41.4% |
| Median | 21.0% | 39.7% |
| Interquartile 25% (IQ1) | 17.0% | 32.6% |
| Interquartile 75% (IQ3) | 23.8% | 47.4% |
| Interquartile Range (IQR) | 6.8% | 14.8% |
| Standard Deviation (Sample) | 7.2% | 14.2% |
| Standard Deviation (Population) | 7.1% | 14.1% |
Similar Demographics by Disability Age 65 to 74
Demographics Similar to Immigrants from Venezuela by Disability Age 65 to 74
In terms of disability age 65 to 74, the demographic groups most similar to Immigrants from Venezuela are Cambodian (21.8%, a difference of 0.010%), Mongolian (21.8%, a difference of 0.030%), Greek (21.8%, a difference of 0.040%), Immigrants from Poland (21.8%, a difference of 0.090%), and Immigrants from Eastern Europe (21.8%, a difference of 0.15%).
| Demographics | Rating | Rank | Disability Age 65 to 74 |
| Maltese | 99.4 /100 | #66 | Exceptional 21.6% |
| Immigrants | South Africa | 99.3 /100 | #67 | Exceptional 21.7% |
| Immigrants | Scotland | 99.3 /100 | #68 | Exceptional 21.7% |
| Immigrants | Egypt | 99.2 /100 | #69 | Exceptional 21.7% |
| Chinese | 99.2 /100 | #70 | Exceptional 21.7% |
| Immigrants | Belarus | 99.2 /100 | #71 | Exceptional 21.7% |
| Immigrants | Hungary | 99.2 /100 | #72 | Exceptional 21.7% |
| Immigrants | Venezuela | 99.0 /100 | #73 | Exceptional 21.8% |
| Cambodians | 99.0 /100 | #74 | Exceptional 21.8% |
| Mongolians | 99.0 /100 | #75 | Exceptional 21.8% |
| Greeks | 99.0 /100 | #76 | Exceptional 21.8% |
| Immigrants | Poland | 99.0 /100 | #77 | Exceptional 21.8% |
| Immigrants | Eastern Europe | 99.0 /100 | #78 | Exceptional 21.8% |
| Venezuelans | 99.0 /100 | #79 | Exceptional 21.8% |
| Immigrants | Norway | 98.9 /100 | #80 | Exceptional 21.8% |
Demographics Similar to Cherokee by Disability Age 65 to 74
In terms of disability age 65 to 74, the demographic groups most similar to Cherokee are Arapaho (28.1%, a difference of 0.39%), Comanche (28.3%, a difference of 0.51%), Nepalese (28.0%, a difference of 0.62%), Immigrants from Armenia (28.0%, a difference of 0.84%), and Aleut (28.4%, a difference of 0.84%).
| Demographics | Rating | Rank | Disability Age 65 to 74 |
| Paiute | 0.0 /100 | #313 | Tragic 27.8% |
| Chippewa | 0.0 /100 | #314 | Tragic 27.8% |
| Cajuns | 0.0 /100 | #315 | Tragic 27.9% |
| Crow | 0.0 /100 | #316 | Tragic 27.9% |
| Immigrants | Armenia | 0.0 /100 | #317 | Tragic 28.0% |
| Nepalese | 0.0 /100 | #318 | Tragic 28.0% |
| Arapaho | 0.0 /100 | #319 | Tragic 28.1% |
| Cherokee | 0.0 /100 | #320 | Tragic 28.2% |
| Comanche | 0.0 /100 | #321 | Tragic 28.3% |
| Aleuts | 0.0 /100 | #322 | Tragic 28.4% |
| Puerto Ricans | 0.0 /100 | #323 | Tragic 29.1% |
| Seminole | 0.0 /100 | #324 | Tragic 29.4% |
| Dutch West Indians | 0.0 /100 | #325 | Tragic 29.6% |
| Yakama | 0.0 /100 | #326 | Tragic 29.6% |
| Apache | 0.0 /100 | #327 | Tragic 29.7% |