British West Indian vs Hawaiian Disability Age 65 to 74
COMPARE
British West Indian
Hawaiian
Disability Age 65 to 74
Disability Age 65 to 74 Comparison
British West Indians
Hawaiians
24.7%
DISABILITY AGE 65 TO 74
2.0/ 100
METRIC RATING
245th/ 347
METRIC RANK
25.5%
DISABILITY AGE 65 TO 74
0.2/ 100
METRIC RATING
264th/ 347
METRIC RANK
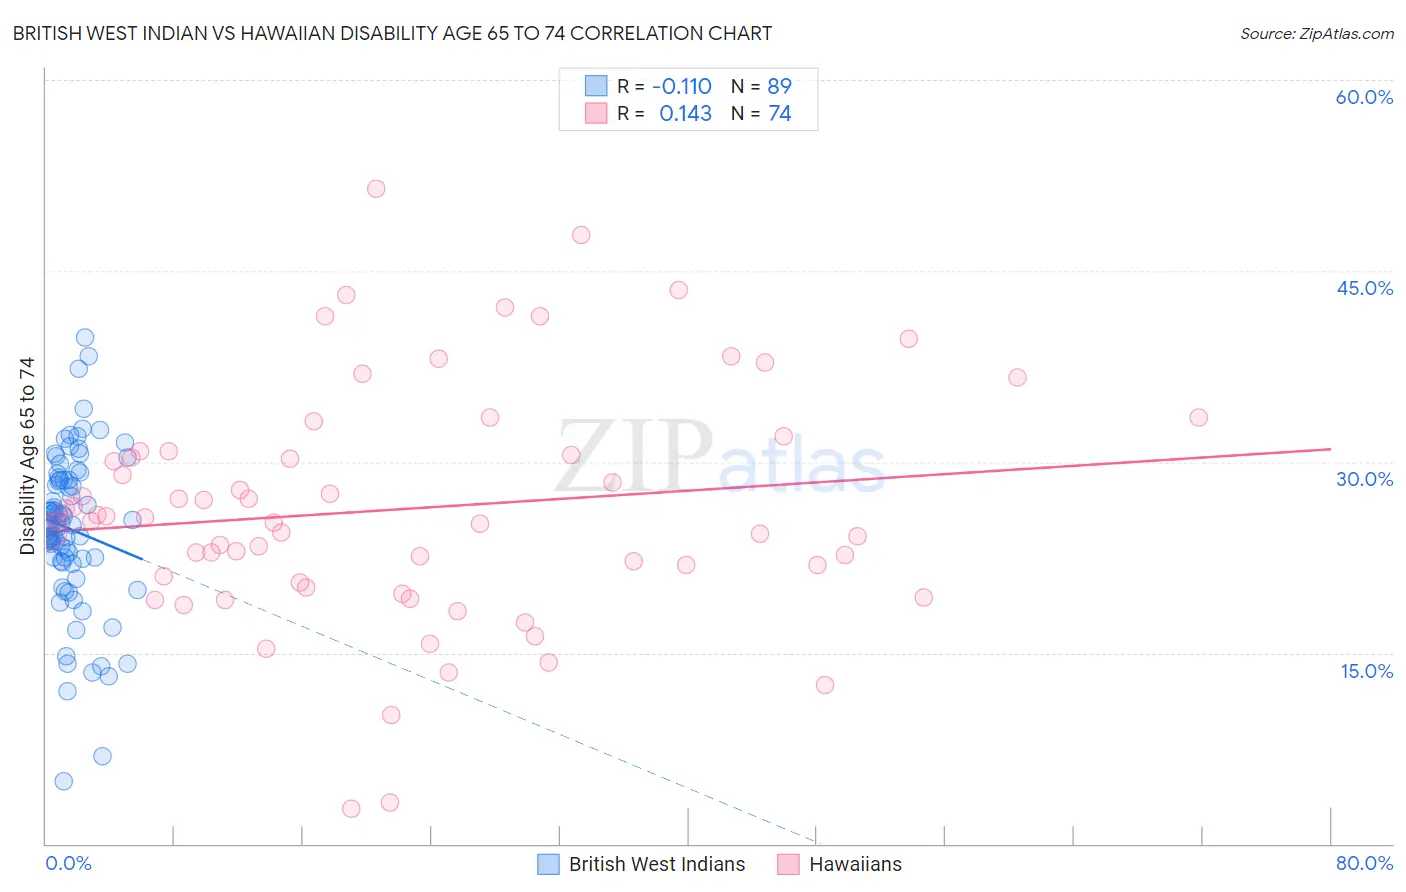
British West Indian vs Hawaiian Disability Age 65 to 74 Correlation Chart
The statistical analysis conducted on geographies consisting of 152,475,853 people shows a poor negative correlation between the proportion of British West Indians and percentage of population with a disability between the ages 65 and 75 in the United States with a correlation coefficient (R) of -0.110 and weighted average of 24.7%. Similarly, the statistical analysis conducted on geographies consisting of 326,781,274 people shows a poor positive correlation between the proportion of Hawaiians and percentage of population with a disability between the ages 65 and 75 in the United States with a correlation coefficient (R) of 0.143 and weighted average of 25.5%, a difference of 3.5%.
Disability Age 65 to 74 Correlation Summary
| Measurement | British West Indian | Hawaiian |
| Minimum | 4.9% | 2.7% |
| Maximum | 39.7% | 51.5% |
| Range | 34.8% | 48.8% |
| Mean | 24.7% | 26.3% |
| Median | 25.1% | 25.4% |
| Interquartile 25% (IQ1) | 22.3% | 20.5% |
| Interquartile 75% (IQ3) | 28.6% | 30.8% |
| Interquartile Range (IQR) | 6.3% | 10.3% |
| Standard Deviation (Sample) | 6.2% | 9.4% |
| Standard Deviation (Population) | 6.2% | 9.3% |
Demographics Similar to British West Indians and Hawaiians by Disability Age 65 to 74
In terms of disability age 65 to 74, the demographic groups most similar to British West Indians are Armenian (24.7%, a difference of 0.0%), Immigrants from Iraq (24.7%, a difference of 0.060%), Indonesian (24.9%, a difference of 0.86%), Senegalese (24.9%, a difference of 1.1%), and Immigrants from Fiji (25.0%, a difference of 1.2%). Similarly, the demographic groups most similar to Hawaiians are Iroquois (25.4%, a difference of 0.34%), Samoan (25.4%, a difference of 0.35%), Cape Verdean (25.4%, a difference of 0.45%), Malaysian (25.4%, a difference of 0.53%), and Immigrants from Cambodia (25.3%, a difference of 0.84%).
| Demographics | Rating | Rank | Disability Age 65 to 74 |
| Armenians | 2.0 /100 | #244 | Tragic 24.7% |
| British West Indians | 2.0 /100 | #245 | Tragic 24.7% |
| Immigrants | Iraq | 1.9 /100 | #246 | Tragic 24.7% |
| Indonesians | 1.1 /100 | #247 | Tragic 24.9% |
| Senegalese | 0.9 /100 | #248 | Tragic 24.9% |
| Immigrants | Fiji | 0.8 /100 | #249 | Tragic 25.0% |
| Salvadorans | 0.8 /100 | #250 | Tragic 25.0% |
| Immigrants | Nonimmigrants | 0.7 /100 | #251 | Tragic 25.0% |
| Immigrants | El Salvador | 0.6 /100 | #252 | Tragic 25.1% |
| Sub-Saharan Africans | 0.6 /100 | #253 | Tragic 25.1% |
| Somalis | 0.6 /100 | #254 | Tragic 25.1% |
| Central Americans | 0.5 /100 | #255 | Tragic 25.1% |
| Immigrants | Somalia | 0.4 /100 | #256 | Tragic 25.2% |
| Guamanians/Chamorros | 0.3 /100 | #257 | Tragic 25.3% |
| Marshallese | 0.3 /100 | #258 | Tragic 25.3% |
| Immigrants | Cambodia | 0.3 /100 | #259 | Tragic 25.3% |
| Malaysians | 0.2 /100 | #260 | Tragic 25.4% |
| Cape Verdeans | 0.2 /100 | #261 | Tragic 25.4% |
| Samoans | 0.2 /100 | #262 | Tragic 25.4% |
| Iroquois | 0.2 /100 | #263 | Tragic 25.4% |
| Hawaiians | 0.2 /100 | #264 | Tragic 25.5% |