Yugoslavian vs Zimbabwean Disability
COMPARE
Yugoslavian
Zimbabwean
Disability
Disability Comparison
Yugoslavians
Zimbabweans
12.2%
DISABILITY
1.7/ 100
METRIC RATING
241st/ 347
METRIC RANK
10.9%
DISABILITY
99.7/ 100
METRIC RATING
60th/ 347
METRIC RANK
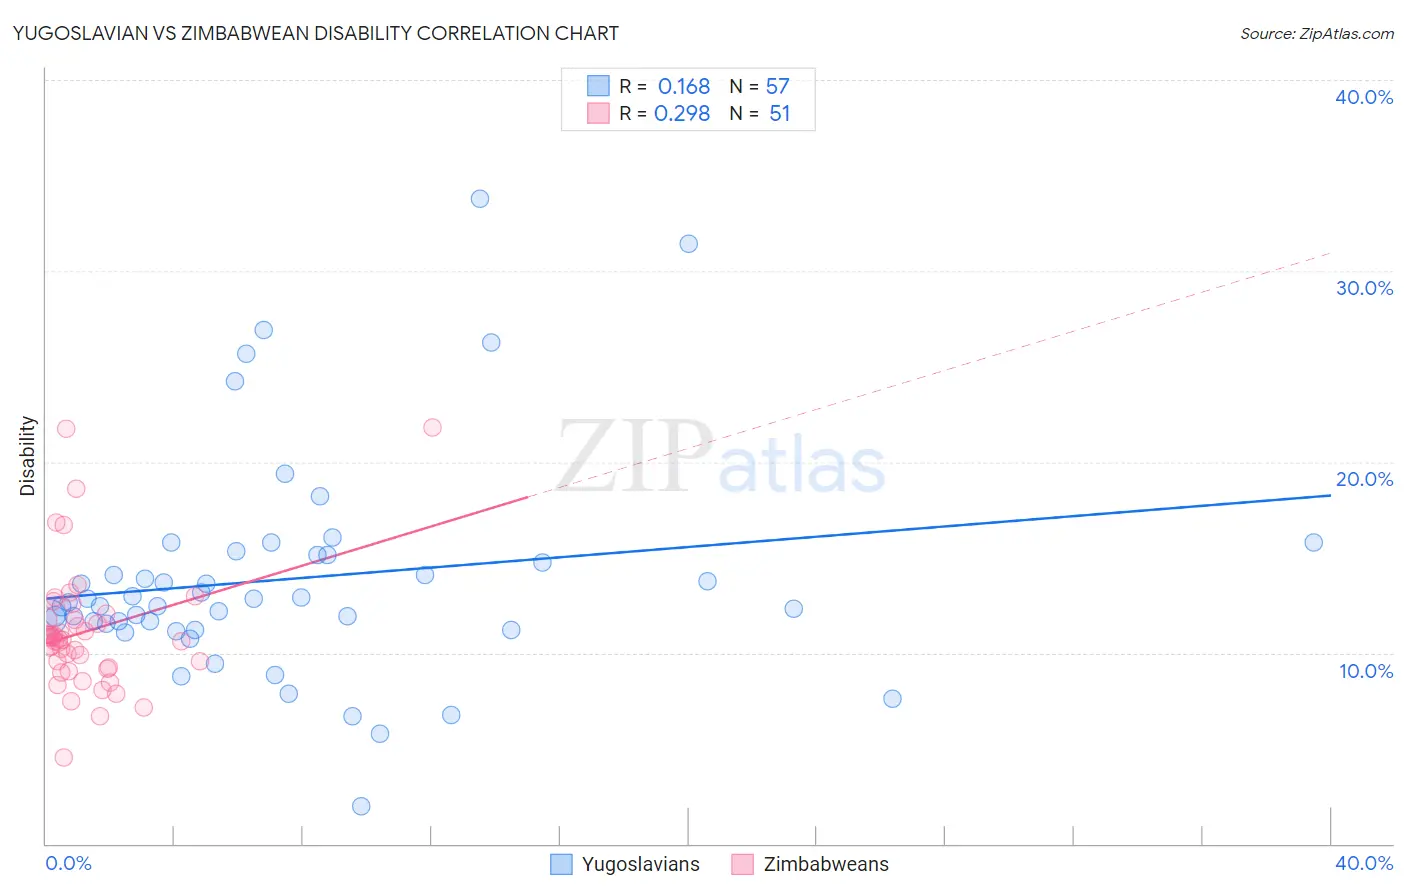
Yugoslavian vs Zimbabwean Disability Correlation Chart
The statistical analysis conducted on geographies consisting of 285,695,841 people shows a poor positive correlation between the proportion of Yugoslavians and percentage of population with a disability in the United States with a correlation coefficient (R) of 0.168 and weighted average of 12.2%. Similarly, the statistical analysis conducted on geographies consisting of 69,206,588 people shows a weak positive correlation between the proportion of Zimbabweans and percentage of population with a disability in the United States with a correlation coefficient (R) of 0.298 and weighted average of 10.9%, a difference of 11.8%.
Disability Correlation Summary
| Measurement | Yugoslavian | Zimbabwean |
| Minimum | 2.0% | 4.5% |
| Maximum | 33.8% | 21.8% |
| Range | 31.8% | 17.3% |
| Mean | 13.9% | 11.1% |
| Median | 12.6% | 10.7% |
| Interquartile 25% (IQ1) | 11.4% | 9.2% |
| Interquartile 75% (IQ3) | 15.1% | 11.8% |
| Interquartile Range (IQR) | 3.8% | 2.5% |
| Standard Deviation (Sample) | 5.8% | 3.3% |
| Standard Deviation (Population) | 5.8% | 3.2% |
Similar Demographics by Disability
Demographics Similar to Yugoslavians by Disability
In terms of disability, the demographic groups most similar to Yugoslavians are Hungarian (12.2%, a difference of 0.0%), Polish (12.2%, a difference of 0.020%), Swedish (12.2%, a difference of 0.050%), Norwegian (12.2%, a difference of 0.090%), and British (12.2%, a difference of 0.11%).
| Demographics | Rating | Rank | Disability |
| Japanese | 2.3 /100 | #234 | Tragic 12.2% |
| Yup'ik | 2.2 /100 | #235 | Tragic 12.2% |
| Chinese | 2.0 /100 | #236 | Tragic 12.2% |
| Immigrants | Congo | 1.9 /100 | #237 | Tragic 12.2% |
| Norwegians | 1.9 /100 | #238 | Tragic 12.2% |
| Swedes | 1.8 /100 | #239 | Tragic 12.2% |
| Hungarians | 1.7 /100 | #240 | Tragic 12.2% |
| Yugoslavians | 1.7 /100 | #241 | Tragic 12.2% |
| Poles | 1.7 /100 | #242 | Tragic 12.2% |
| British | 1.5 /100 | #243 | Tragic 12.2% |
| Basques | 1.5 /100 | #244 | Tragic 12.2% |
| Liberians | 1.5 /100 | #245 | Tragic 12.2% |
| Swiss | 1.5 /100 | #246 | Tragic 12.2% |
| Indonesians | 1.4 /100 | #247 | Tragic 12.2% |
| Guamanians/Chamorros | 1.4 /100 | #248 | Tragic 12.3% |
Demographics Similar to Zimbabweans by Disability
In terms of disability, the demographic groups most similar to Zimbabweans are Immigrants from Bulgaria (10.9%, a difference of 0.060%), Immigrants from Colombia (10.9%, a difference of 0.090%), Immigrants from Northern Africa (10.9%, a difference of 0.10%), Immigrants from Eritrea (11.0%, a difference of 0.11%), and Immigrants from South America (10.9%, a difference of 0.18%).
| Demographics | Rating | Rank | Disability |
| Immigrants | Spain | 99.8 /100 | #53 | Exceptional 10.9% |
| Jordanians | 99.8 /100 | #54 | Exceptional 10.9% |
| Immigrants | El Salvador | 99.8 /100 | #55 | Exceptional 10.9% |
| Immigrants | Lithuania | 99.8 /100 | #56 | Exceptional 10.9% |
| Salvadorans | 99.8 /100 | #57 | Exceptional 10.9% |
| Immigrants | South America | 99.8 /100 | #58 | Exceptional 10.9% |
| Immigrants | Colombia | 99.7 /100 | #59 | Exceptional 10.9% |
| Zimbabweans | 99.7 /100 | #60 | Exceptional 10.9% |
| Immigrants | Bulgaria | 99.7 /100 | #61 | Exceptional 10.9% |
| Immigrants | Northern Africa | 99.7 /100 | #62 | Exceptional 10.9% |
| Immigrants | Eritrea | 99.7 /100 | #63 | Exceptional 11.0% |
| Immigrants | Sweden | 99.6 /100 | #64 | Exceptional 11.0% |
| Bulgarians | 99.6 /100 | #65 | Exceptional 11.0% |
| Laotians | 99.6 /100 | #66 | Exceptional 11.0% |
| Colombians | 99.6 /100 | #67 | Exceptional 11.0% |