Immigrants from Africa vs Zimbabwean Disability
COMPARE
Immigrants from Africa
Zimbabwean
Disability
Disability Comparison
Immigrants from Africa
Zimbabweans
11.4%
DISABILITY
89.3/ 100
METRIC RATING
132nd/ 347
METRIC RANK
10.9%
DISABILITY
99.7/ 100
METRIC RATING
60th/ 347
METRIC RANK
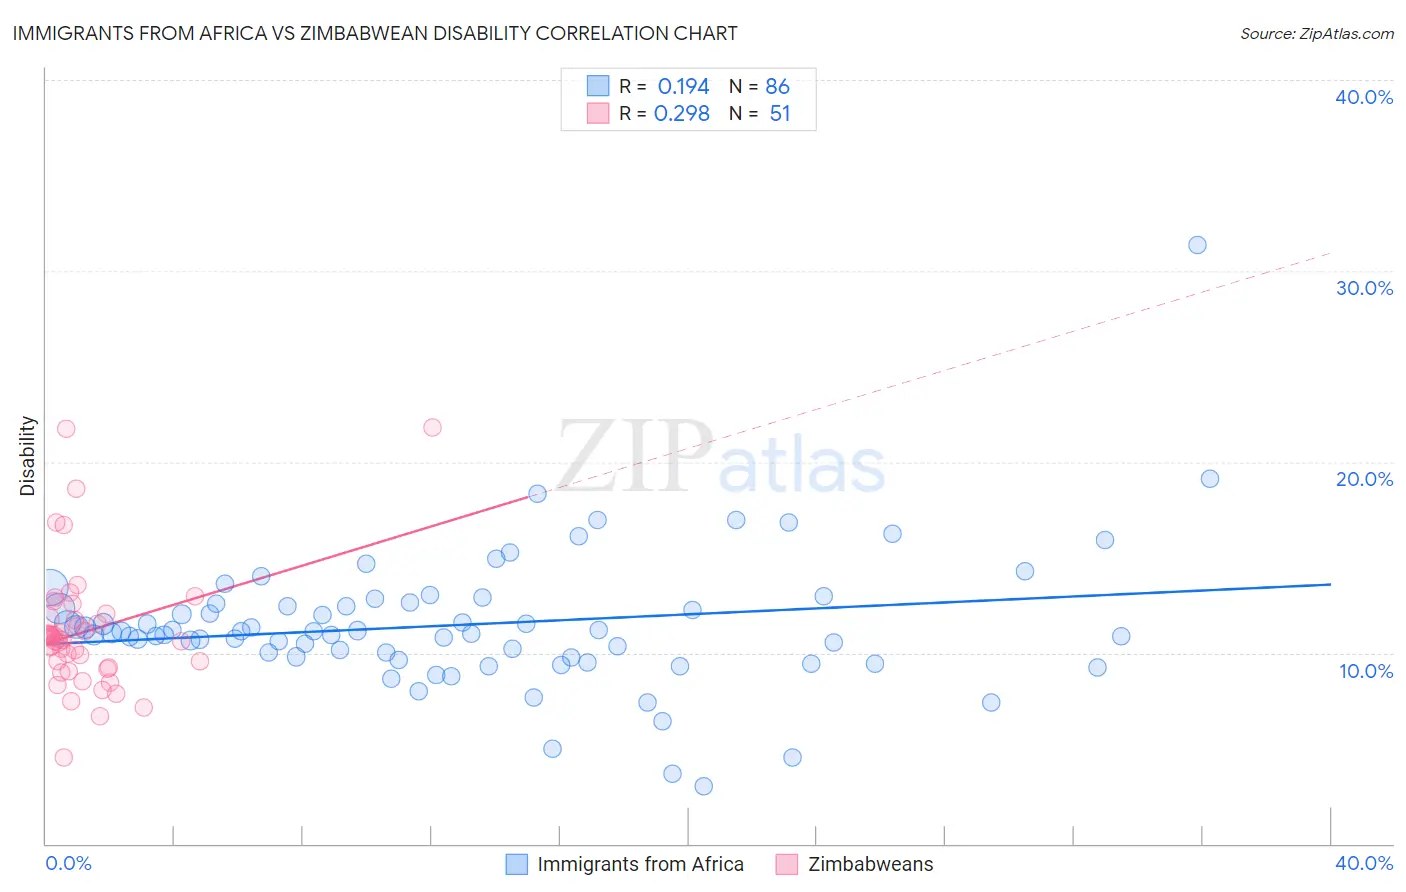
Immigrants from Africa vs Zimbabwean Disability Correlation Chart
The statistical analysis conducted on geographies consisting of 469,357,699 people shows a poor positive correlation between the proportion of Immigrants from Africa and percentage of population with a disability in the United States with a correlation coefficient (R) of 0.194 and weighted average of 11.4%. Similarly, the statistical analysis conducted on geographies consisting of 69,206,588 people shows a weak positive correlation between the proportion of Zimbabweans and percentage of population with a disability in the United States with a correlation coefficient (R) of 0.298 and weighted average of 10.9%, a difference of 4.4%.
Disability Correlation Summary
| Measurement | Immigrants from Africa | Zimbabwean |
| Minimum | 3.0% | 4.5% |
| Maximum | 31.3% | 21.8% |
| Range | 28.3% | 17.3% |
| Mean | 11.5% | 11.1% |
| Median | 11.1% | 10.7% |
| Interquartile 25% (IQ1) | 9.8% | 9.2% |
| Interquartile 75% (IQ3) | 12.6% | 11.8% |
| Interquartile Range (IQR) | 2.8% | 2.5% |
| Standard Deviation (Sample) | 3.6% | 3.3% |
| Standard Deviation (Population) | 3.6% | 3.2% |
Similar Demographics by Disability
Demographics Similar to Immigrants from Africa by Disability
In terms of disability, the demographic groups most similar to Immigrants from Africa are Arab (11.4%, a difference of 0.030%), Immigrants from Croatia (11.4%, a difference of 0.060%), Latvian (11.4%, a difference of 0.070%), Immigrants from Guyana (11.4%, a difference of 0.11%), and Macedonian (11.4%, a difference of 0.12%).
| Demographics | Rating | Rank | Disability |
| Costa Ricans | 91.9 /100 | #125 | Exceptional 11.4% |
| Immigrants | Latvia | 90.9 /100 | #126 | Exceptional 11.4% |
| Immigrants | Italy | 90.4 /100 | #127 | Exceptional 11.4% |
| Immigrants | Europe | 90.4 /100 | #128 | Exceptional 11.4% |
| Macedonians | 90.3 /100 | #129 | Exceptional 11.4% |
| Latvians | 89.8 /100 | #130 | Excellent 11.4% |
| Immigrants | Croatia | 89.8 /100 | #131 | Excellent 11.4% |
| Immigrants | Africa | 89.3 /100 | #132 | Excellent 11.4% |
| Arabs | 89.1 /100 | #133 | Excellent 11.4% |
| Immigrants | Guyana | 88.3 /100 | #134 | Excellent 11.4% |
| Ugandans | 87.9 /100 | #135 | Excellent 11.4% |
| Immigrants | St. Vincent and the Grenadines | 87.8 /100 | #136 | Excellent 11.4% |
| Kenyans | 87.1 /100 | #137 | Excellent 11.5% |
| New Zealanders | 87.0 /100 | #138 | Excellent 11.5% |
| Ghanaians | 87.0 /100 | #139 | Excellent 11.5% |
Demographics Similar to Zimbabweans by Disability
In terms of disability, the demographic groups most similar to Zimbabweans are Immigrants from Bulgaria (10.9%, a difference of 0.060%), Immigrants from Colombia (10.9%, a difference of 0.090%), Immigrants from Northern Africa (10.9%, a difference of 0.10%), Immigrants from Eritrea (11.0%, a difference of 0.11%), and Immigrants from South America (10.9%, a difference of 0.18%).
| Demographics | Rating | Rank | Disability |
| Immigrants | Spain | 99.8 /100 | #53 | Exceptional 10.9% |
| Jordanians | 99.8 /100 | #54 | Exceptional 10.9% |
| Immigrants | El Salvador | 99.8 /100 | #55 | Exceptional 10.9% |
| Immigrants | Lithuania | 99.8 /100 | #56 | Exceptional 10.9% |
| Salvadorans | 99.8 /100 | #57 | Exceptional 10.9% |
| Immigrants | South America | 99.8 /100 | #58 | Exceptional 10.9% |
| Immigrants | Colombia | 99.7 /100 | #59 | Exceptional 10.9% |
| Zimbabweans | 99.7 /100 | #60 | Exceptional 10.9% |
| Immigrants | Bulgaria | 99.7 /100 | #61 | Exceptional 10.9% |
| Immigrants | Northern Africa | 99.7 /100 | #62 | Exceptional 10.9% |
| Immigrants | Eritrea | 99.7 /100 | #63 | Exceptional 11.0% |
| Immigrants | Sweden | 99.6 /100 | #64 | Exceptional 11.0% |
| Bulgarians | 99.6 /100 | #65 | Exceptional 11.0% |
| Laotians | 99.6 /100 | #66 | Exceptional 11.0% |
| Colombians | 99.6 /100 | #67 | Exceptional 11.0% |