Iraqi vs Immigrants from Switzerland Hearing Disability
COMPARE
Iraqi
Immigrants from Switzerland
Hearing Disability
Hearing Disability Comparison
Iraqis
Immigrants from Switzerland
3.1%
HEARING DISABILITY
19.0/ 100
METRIC RATING
201st/ 347
METRIC RANK
3.1%
HEARING DISABILITY
28.8/ 100
METRIC RATING
191st/ 347
METRIC RANK
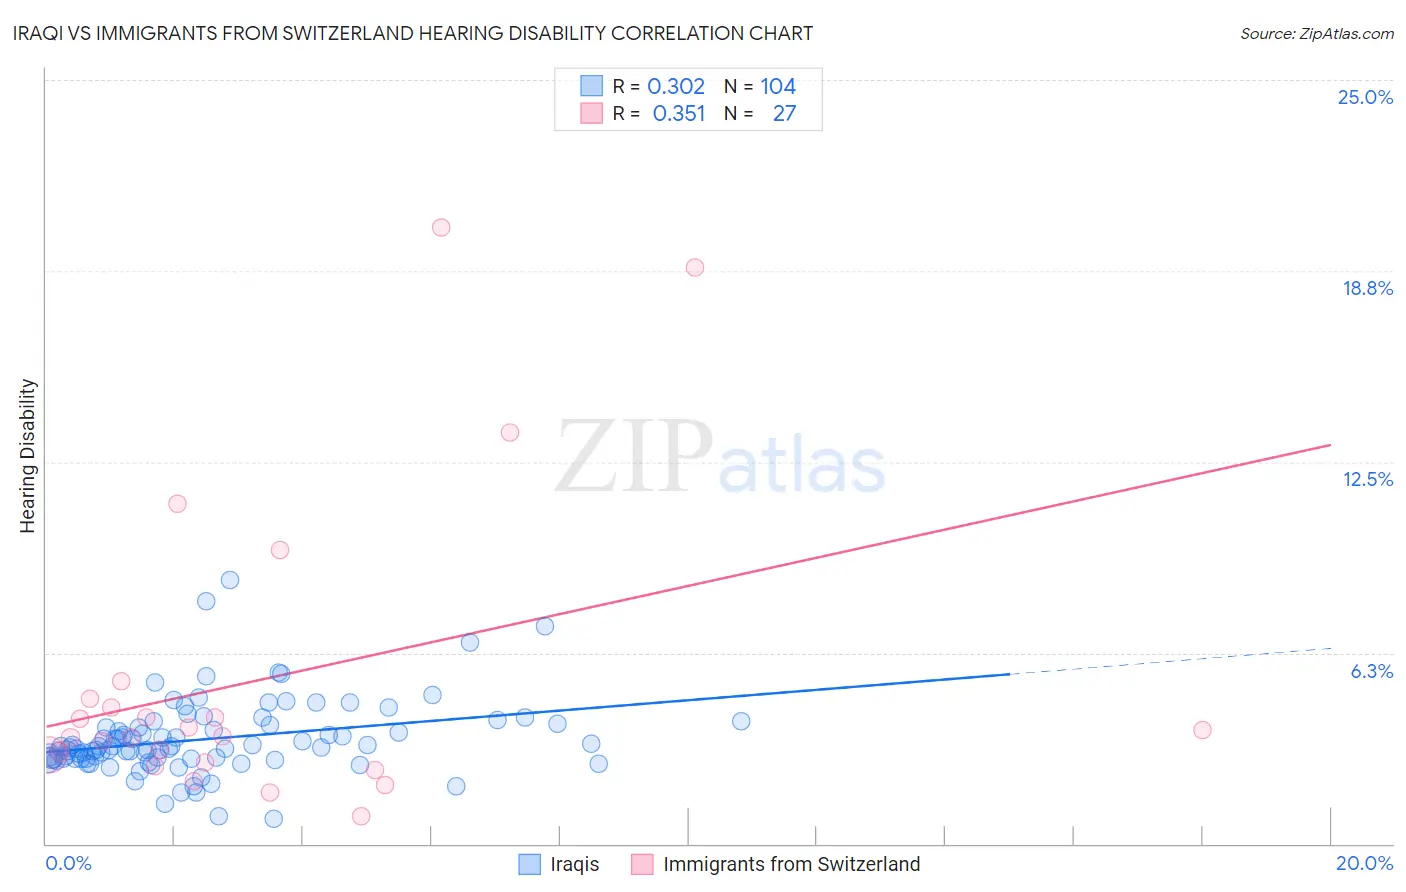
Iraqi vs Immigrants from Switzerland Hearing Disability Correlation Chart
The statistical analysis conducted on geographies consisting of 170,639,688 people shows a mild positive correlation between the proportion of Iraqis and percentage of population with hearing disability in the United States with a correlation coefficient (R) of 0.302 and weighted average of 3.1%. Similarly, the statistical analysis conducted on geographies consisting of 148,077,684 people shows a mild positive correlation between the proportion of Immigrants from Switzerland and percentage of population with hearing disability in the United States with a correlation coefficient (R) of 0.351 and weighted average of 3.1%, a difference of 1.3%.
Hearing Disability Correlation Summary
| Measurement | Iraqi | Immigrants from Switzerland |
| Minimum | 0.83% | 0.89% |
| Maximum | 8.7% | 20.2% |
| Range | 7.8% | 19.3% |
| Mean | 3.4% | 5.4% |
| Median | 3.1% | 3.5% |
| Interquartile 25% (IQ1) | 2.8% | 2.7% |
| Interquartile 75% (IQ3) | 3.9% | 4.7% |
| Interquartile Range (IQR) | 1.1% | 2.1% |
| Standard Deviation (Sample) | 1.2% | 5.0% |
| Standard Deviation (Population) | 1.2% | 4.9% |
Demographics Similar to Iraqis and Immigrants from Switzerland by Hearing Disability
In terms of hearing disability, the demographic groups most similar to Iraqis are Immigrants from North Macedonia (3.1%, a difference of 0.020%), Syrian (3.1%, a difference of 0.030%), Immigrants from Croatia (3.1%, a difference of 0.22%), Immigrants from Bosnia and Herzegovina (3.1%, a difference of 0.24%), and Immigrants from Thailand (3.1%, a difference of 0.40%). Similarly, the demographic groups most similar to Immigrants from Switzerland are Korean (3.1%, a difference of 0.13%), Macedonian (3.1%, a difference of 0.21%), Immigrants from South Africa (3.1%, a difference of 0.25%), African (3.0%, a difference of 0.44%), and South African (3.1%, a difference of 0.51%).
| Demographics | Rating | Rank | Hearing Disability |
| Immigrants | Mexico | 34.9 /100 | #186 | Fair 3.0% |
| Blacks/African Americans | 34.7 /100 | #187 | Fair 3.0% |
| Mexican American Indians | 34.7 /100 | #188 | Fair 3.0% |
| Africans | 32.9 /100 | #189 | Fair 3.0% |
| Immigrants | South Africa | 31.1 /100 | #190 | Fair 3.1% |
| Immigrants | Switzerland | 28.8 /100 | #191 | Fair 3.1% |
| Koreans | 27.6 /100 | #192 | Fair 3.1% |
| Macedonians | 27.0 /100 | #193 | Fair 3.1% |
| South Africans | 24.5 /100 | #194 | Fair 3.1% |
| Spanish American Indians | 24.1 /100 | #195 | Fair 3.1% |
| Immigrants | Europe | 22.9 /100 | #196 | Fair 3.1% |
| Immigrants | Bosnia and Herzegovina | 20.6 /100 | #197 | Fair 3.1% |
| Immigrants | Croatia | 20.5 /100 | #198 | Fair 3.1% |
| Syrians | 19.2 /100 | #199 | Poor 3.1% |
| Immigrants | North Macedonia | 19.1 /100 | #200 | Poor 3.1% |
| Iraqis | 19.0 /100 | #201 | Poor 3.1% |
| Immigrants | Thailand | 16.4 /100 | #202 | Poor 3.1% |
| Immigrants | Denmark | 16.2 /100 | #203 | Poor 3.1% |
| Immigrants | Czechoslovakia | 15.9 /100 | #204 | Poor 3.1% |
| Alsatians | 15.9 /100 | #205 | Poor 3.1% |
| Eastern Europeans | 15.5 /100 | #206 | Poor 3.1% |