Thai vs Immigrants from Switzerland Hearing Disability
COMPARE
Thai
Immigrants from Switzerland
Hearing Disability
Hearing Disability Comparison
Thais
Immigrants from Switzerland
2.5%
HEARING DISABILITY
99.8/ 100
METRIC RATING
19th/ 347
METRIC RANK
3.1%
HEARING DISABILITY
28.8/ 100
METRIC RATING
191st/ 347
METRIC RANK
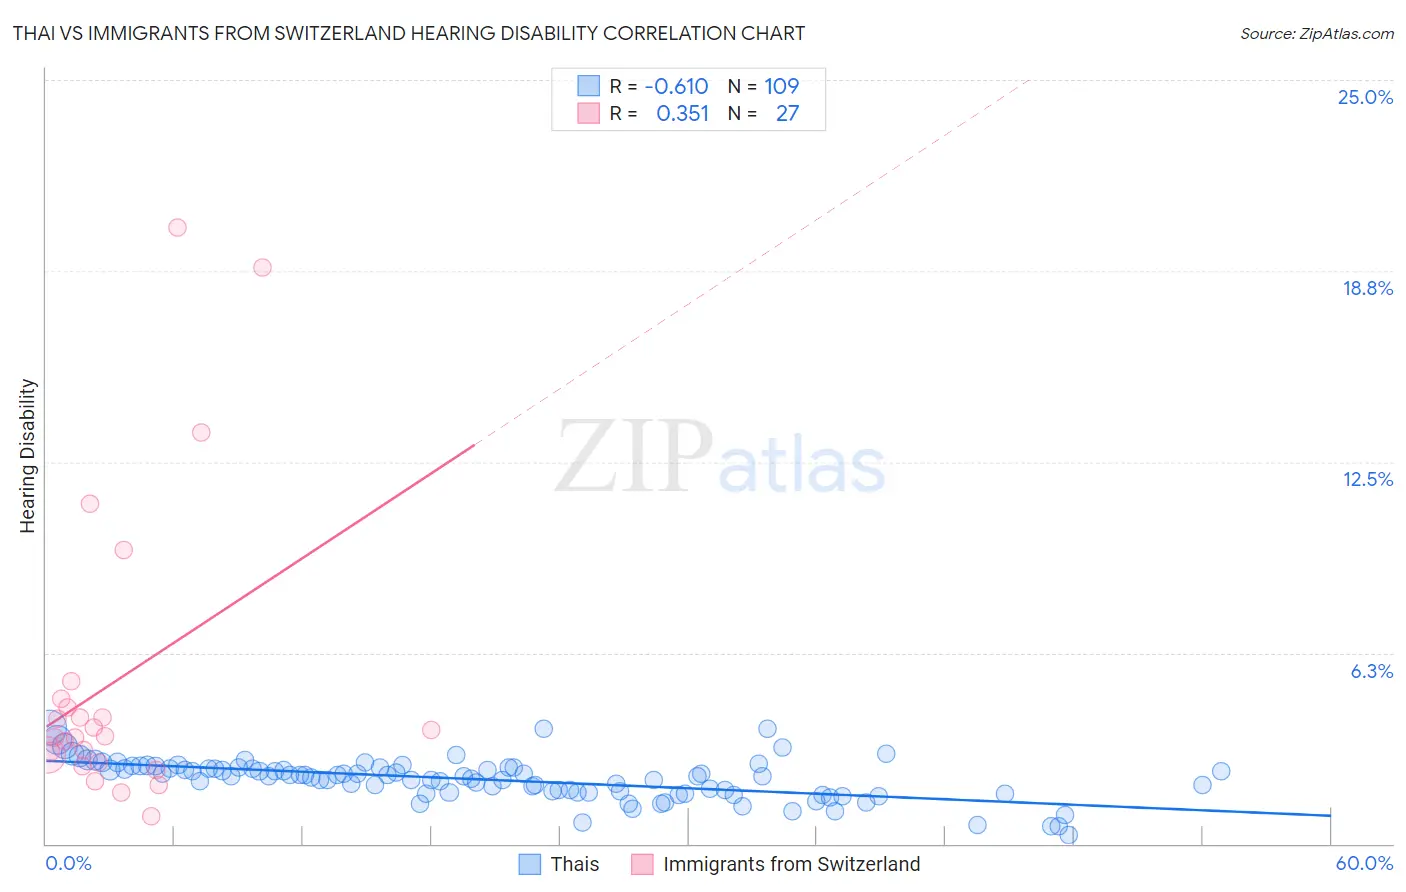
Thai vs Immigrants from Switzerland Hearing Disability Correlation Chart
The statistical analysis conducted on geographies consisting of 475,566,624 people shows a significant negative correlation between the proportion of Thais and percentage of population with hearing disability in the United States with a correlation coefficient (R) of -0.610 and weighted average of 2.5%. Similarly, the statistical analysis conducted on geographies consisting of 148,077,684 people shows a mild positive correlation between the proportion of Immigrants from Switzerland and percentage of population with hearing disability in the United States with a correlation coefficient (R) of 0.351 and weighted average of 3.1%, a difference of 20.1%.
Hearing Disability Correlation Summary
| Measurement | Thai | Immigrants from Switzerland |
| Minimum | 0.30% | 0.89% |
| Maximum | 3.8% | 20.2% |
| Range | 3.5% | 19.3% |
| Mean | 2.1% | 5.4% |
| Median | 2.2% | 3.5% |
| Interquartile 25% (IQ1) | 1.7% | 2.7% |
| Interquartile 75% (IQ3) | 2.5% | 4.7% |
| Interquartile Range (IQR) | 0.79% | 2.1% |
| Standard Deviation (Sample) | 0.65% | 5.0% |
| Standard Deviation (Population) | 0.65% | 4.9% |
Similar Demographics by Hearing Disability
Demographics Similar to Thais by Hearing Disability
In terms of hearing disability, the demographic groups most similar to Thais are Dominican (2.5%, a difference of 0.030%), Immigrants from Bolivia (2.5%, a difference of 0.050%), Ghanaian (2.5%, a difference of 0.11%), Immigrants from Sierra Leone (2.6%, a difference of 0.16%), and Immigrants from Nigeria (2.6%, a difference of 0.65%).
| Demographics | Rating | Rank | Hearing Disability |
| Trinidadians and Tobagonians | 99.9 /100 | #12 | Exceptional 2.5% |
| Sierra Leoneans | 99.9 /100 | #13 | Exceptional 2.5% |
| Ecuadorians | 99.9 /100 | #14 | Exceptional 2.5% |
| Barbadians | 99.9 /100 | #15 | Exceptional 2.5% |
| Immigrants | West Indies | 99.9 /100 | #16 | Exceptional 2.5% |
| Immigrants | India | 99.9 /100 | #17 | Exceptional 2.5% |
| Dominicans | 99.8 /100 | #18 | Exceptional 2.5% |
| Thais | 99.8 /100 | #19 | Exceptional 2.5% |
| Immigrants | Bolivia | 99.8 /100 | #20 | Exceptional 2.5% |
| Ghanaians | 99.8 /100 | #21 | Exceptional 2.5% |
| Immigrants | Sierra Leone | 99.8 /100 | #22 | Exceptional 2.6% |
| Immigrants | Nigeria | 99.8 /100 | #23 | Exceptional 2.6% |
| Immigrants | Ghana | 99.8 /100 | #24 | Exceptional 2.6% |
| Immigrants | El Salvador | 99.7 /100 | #25 | Exceptional 2.6% |
| Immigrants | Senegal | 99.7 /100 | #26 | Exceptional 2.6% |
Demographics Similar to Immigrants from Switzerland by Hearing Disability
In terms of hearing disability, the demographic groups most similar to Immigrants from Switzerland are Korean (3.1%, a difference of 0.13%), Macedonian (3.1%, a difference of 0.21%), Immigrants from South Africa (3.1%, a difference of 0.25%), African (3.0%, a difference of 0.44%), and South African (3.1%, a difference of 0.51%).
| Demographics | Rating | Rank | Hearing Disability |
| Immigrants | Ireland | 37.4 /100 | #184 | Fair 3.0% |
| Immigrants | Southern Europe | 35.3 /100 | #185 | Fair 3.0% |
| Immigrants | Mexico | 34.9 /100 | #186 | Fair 3.0% |
| Blacks/African Americans | 34.7 /100 | #187 | Fair 3.0% |
| Mexican American Indians | 34.7 /100 | #188 | Fair 3.0% |
| Africans | 32.9 /100 | #189 | Fair 3.0% |
| Immigrants | South Africa | 31.1 /100 | #190 | Fair 3.1% |
| Immigrants | Switzerland | 28.8 /100 | #191 | Fair 3.1% |
| Koreans | 27.6 /100 | #192 | Fair 3.1% |
| Macedonians | 27.0 /100 | #193 | Fair 3.1% |
| South Africans | 24.5 /100 | #194 | Fair 3.1% |
| Spanish American Indians | 24.1 /100 | #195 | Fair 3.1% |
| Immigrants | Europe | 22.9 /100 | #196 | Fair 3.1% |
| Immigrants | Bosnia and Herzegovina | 20.6 /100 | #197 | Fair 3.1% |
| Immigrants | Croatia | 20.5 /100 | #198 | Fair 3.1% |