Yugoslavian vs Cypriot 1st Grade
COMPARE
Yugoslavian
Cypriot
1st Grade
1st Grade Comparison
Yugoslavians
Cypriots
98.2%
1ST GRADE
95.5/ 100
METRIC RATING
117th/ 347
METRIC RANK
98.2%
1ST GRADE
98.3/ 100
METRIC RATING
96th/ 347
METRIC RANK
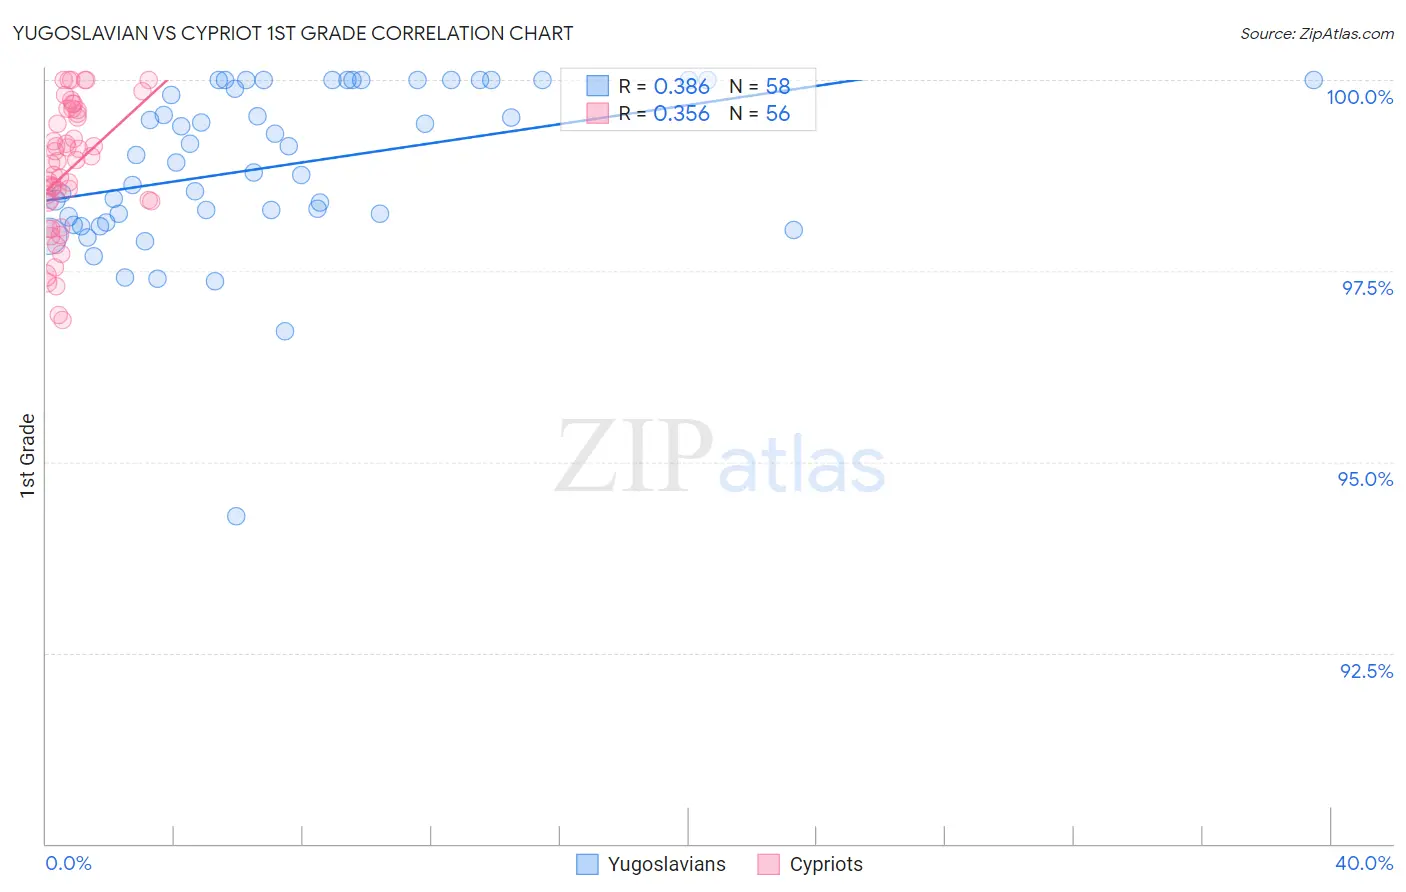
Yugoslavian vs Cypriot 1st Grade Correlation Chart
The statistical analysis conducted on geographies consisting of 285,681,276 people shows a mild positive correlation between the proportion of Yugoslavians and percentage of population with at least 1st grade education in the United States with a correlation coefficient (R) of 0.386 and weighted average of 98.2%. Similarly, the statistical analysis conducted on geographies consisting of 61,867,249 people shows a mild positive correlation between the proportion of Cypriots and percentage of population with at least 1st grade education in the United States with a correlation coefficient (R) of 0.356 and weighted average of 98.2%, a difference of 0.080%.
1st Grade Correlation Summary
| Measurement | Yugoslavian | Cypriot |
| Minimum | 94.3% | 96.9% |
| Maximum | 100.0% | 100.0% |
| Range | 5.7% | 3.1% |
| Mean | 98.9% | 98.8% |
| Median | 99.0% | 98.9% |
| Interquartile 25% (IQ1) | 98.2% | 98.4% |
| Interquartile 75% (IQ3) | 100.0% | 99.6% |
| Interquartile Range (IQR) | 1.8% | 1.2% |
| Standard Deviation (Sample) | 1.1% | 0.84% |
| Standard Deviation (Population) | 1.1% | 0.83% |
Similar Demographics by 1st Grade
Demographics Similar to Yugoslavians by 1st Grade
In terms of 1st grade, the demographic groups most similar to Yugoslavians are Immigrants from France (98.2%, a difference of 0.0%), Ute (98.2%, a difference of 0.010%), Iranian (98.2%, a difference of 0.010%), Spanish (98.2%, a difference of 0.010%), and Thai (98.1%, a difference of 0.010%).
| Demographics | Rating | Rank | 1st Grade |
| Immigrants | Singapore | 96.7 /100 | #110 | Exceptional 98.2% |
| Immigrants | Czechoslovakia | 96.6 /100 | #111 | Exceptional 98.2% |
| Immigrants | Norway | 96.6 /100 | #112 | Exceptional 98.2% |
| Immigrants | Latvia | 96.4 /100 | #113 | Exceptional 98.2% |
| Ute | 96.2 /100 | #114 | Exceptional 98.2% |
| Iranians | 96.0 /100 | #115 | Exceptional 98.2% |
| Spanish | 95.9 /100 | #116 | Exceptional 98.2% |
| Yugoslavians | 95.5 /100 | #117 | Exceptional 98.2% |
| Immigrants | France | 95.5 /100 | #118 | Exceptional 98.2% |
| Thais | 94.7 /100 | #119 | Exceptional 98.1% |
| Okinawans | 94.5 /100 | #120 | Exceptional 98.1% |
| Immigrants | Zimbabwe | 94.0 /100 | #121 | Exceptional 98.1% |
| Menominee | 93.9 /100 | #122 | Exceptional 98.1% |
| Iroquois | 93.8 /100 | #123 | Exceptional 98.1% |
| Syrians | 93.7 /100 | #124 | Exceptional 98.1% |
Demographics Similar to Cypriots by 1st Grade
In terms of 1st grade, the demographic groups most similar to Cypriots are Nonimmigrants (98.2%, a difference of 0.0%), Choctaw (98.2%, a difference of 0.0%), Puget Sound Salish (98.2%, a difference of 0.0%), Immigrants from India (98.2%, a difference of 0.010%), and South African (98.2%, a difference of 0.010%).
| Demographics | Rating | Rank | 1st Grade |
| Immigrants | South Africa | 98.8 /100 | #89 | Exceptional 98.3% |
| Ukrainians | 98.8 /100 | #90 | Exceptional 98.3% |
| Immigrants | Western Europe | 98.8 /100 | #91 | Exceptional 98.3% |
| Macedonians | 98.7 /100 | #92 | Exceptional 98.3% |
| Immigrants | India | 98.6 /100 | #93 | Exceptional 98.2% |
| South Africans | 98.6 /100 | #94 | Exceptional 98.2% |
| Immigrants | Germany | 98.5 /100 | #95 | Exceptional 98.2% |
| Cypriots | 98.3 /100 | #96 | Exceptional 98.2% |
| Immigrants | Nonimmigrants | 98.3 /100 | #97 | Exceptional 98.2% |
| Choctaw | 98.3 /100 | #98 | Exceptional 98.2% |
| Puget Sound Salish | 98.2 /100 | #99 | Exceptional 98.2% |
| Colville | 98.0 /100 | #100 | Exceptional 98.2% |
| Romanians | 97.8 /100 | #101 | Exceptional 98.2% |
| Cree | 97.8 /100 | #102 | Exceptional 98.2% |
| Immigrants | Ireland | 97.7 /100 | #103 | Exceptional 98.2% |