Yugoslavian vs Cypriot Unemployment Among Ages 16 to 19 years
COMPARE
Yugoslavian
Cypriot
Unemployment Among Ages 16 to 19 years
Unemployment Among Ages 16 to 19 years Comparison
Yugoslavians
Cypriots
15.6%
UNEMPLOYMENT AMONG AGES 16 TO 19 YEARS
100.0/ 100
METRIC RATING
15th/ 347
METRIC RANK
19.6%
UNEMPLOYMENT AMONG AGES 16 TO 19 YEARS
0.0/ 100
METRIC RATING
281st/ 347
METRIC RANK
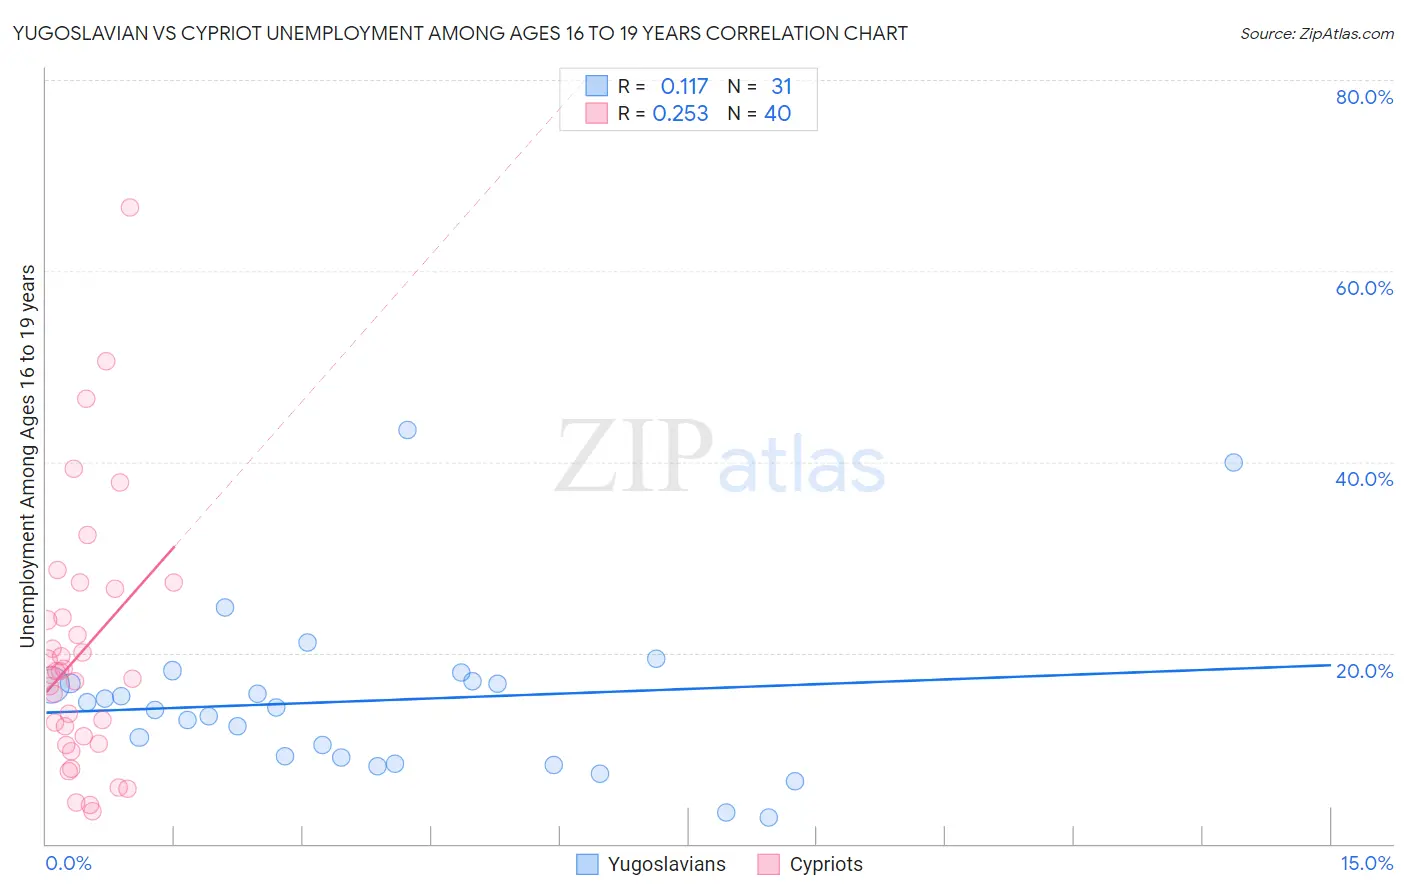
Yugoslavian vs Cypriot Unemployment Among Ages 16 to 19 years Correlation Chart
The statistical analysis conducted on geographies consisting of 274,198,051 people shows a poor positive correlation between the proportion of Yugoslavians and unemployment rate among population between the ages 16 and 19 in the United States with a correlation coefficient (R) of 0.117 and weighted average of 15.6%. Similarly, the statistical analysis conducted on geographies consisting of 60,703,340 people shows a weak positive correlation between the proportion of Cypriots and unemployment rate among population between the ages 16 and 19 in the United States with a correlation coefficient (R) of 0.253 and weighted average of 19.6%, a difference of 25.6%.
Unemployment Among Ages 16 to 19 years Correlation Summary
| Measurement | Yugoslavian | Cypriot |
| Minimum | 2.7% | 3.4% |
| Maximum | 43.3% | 66.7% |
| Range | 40.6% | 63.3% |
| Mean | 15.0% | 20.1% |
| Median | 14.3% | 17.8% |
| Interquartile 25% (IQ1) | 9.0% | 10.9% |
| Interquartile 75% (IQ3) | 17.0% | 25.2% |
| Interquartile Range (IQR) | 7.9% | 14.3% |
| Standard Deviation (Sample) | 8.7% | 13.4% |
| Standard Deviation (Population) | 8.6% | 13.3% |
Similar Demographics by Unemployment Among Ages 16 to 19 years
Demographics Similar to Yugoslavians by Unemployment Among Ages 16 to 19 years
In terms of unemployment among ages 16 to 19 years, the demographic groups most similar to Yugoslavians are Immigrants from Zaire (15.6%, a difference of 0.050%), Immigrants from Burma/Myanmar (15.6%, a difference of 0.20%), German (15.7%, a difference of 0.29%), Somali (15.7%, a difference of 0.50%), and Taiwanese (15.5%, a difference of 0.63%).
| Demographics | Rating | Rank | Unemployment Among Ages 16 to 19 years |
| Czechs | 100.0 /100 | #8 | Exceptional 15.4% |
| Scandinavians | 100.0 /100 | #9 | Exceptional 15.4% |
| Zimbabweans | 100.0 /100 | #10 | Exceptional 15.4% |
| Indonesians | 100.0 /100 | #11 | Exceptional 15.5% |
| Taiwanese | 100.0 /100 | #12 | Exceptional 15.5% |
| Immigrants | Burma/Myanmar | 100.0 /100 | #13 | Exceptional 15.6% |
| Immigrants | Zaire | 100.0 /100 | #14 | Exceptional 15.6% |
| Yugoslavians | 100.0 /100 | #15 | Exceptional 15.6% |
| Germans | 100.0 /100 | #16 | Exceptional 15.7% |
| Somalis | 100.0 /100 | #17 | Exceptional 15.7% |
| Thais | 100.0 /100 | #18 | Exceptional 15.7% |
| Swiss | 100.0 /100 | #19 | Exceptional 15.8% |
| Sudanese | 100.0 /100 | #20 | Exceptional 15.8% |
| Immigrants | Taiwan | 100.0 /100 | #21 | Exceptional 15.8% |
| Finns | 100.0 /100 | #22 | Exceptional 15.9% |
Demographics Similar to Cypriots by Unemployment Among Ages 16 to 19 years
In terms of unemployment among ages 16 to 19 years, the demographic groups most similar to Cypriots are Cajun (19.6%, a difference of 0.17%), Ute (19.6%, a difference of 0.30%), Dutch West Indian (19.7%, a difference of 0.44%), Sioux (19.7%, a difference of 0.49%), and Sierra Leonean (19.7%, a difference of 0.50%).
| Demographics | Rating | Rank | Unemployment Among Ages 16 to 19 years |
| Shoshone | 0.0 /100 | #274 | Tragic 19.3% |
| Paraguayans | 0.0 /100 | #275 | Tragic 19.4% |
| Immigrants | Latin America | 0.0 /100 | #276 | Tragic 19.4% |
| Immigrants | Western Africa | 0.0 /100 | #277 | Tragic 19.4% |
| Africans | 0.0 /100 | #278 | Tragic 19.5% |
| Ute | 0.0 /100 | #279 | Tragic 19.6% |
| Cajuns | 0.0 /100 | #280 | Tragic 19.6% |
| Cypriots | 0.0 /100 | #281 | Tragic 19.6% |
| Dutch West Indians | 0.0 /100 | #282 | Tragic 19.7% |
| Sioux | 0.0 /100 | #283 | Tragic 19.7% |
| Sierra Leoneans | 0.0 /100 | #284 | Tragic 19.7% |
| Ghanaians | 0.0 /100 | #285 | Tragic 19.8% |
| Bahamians | 0.0 /100 | #286 | Tragic 19.8% |
| Immigrants | Ghana | 0.0 /100 | #287 | Tragic 19.8% |
| Immigrants | Azores | 0.0 /100 | #288 | Tragic 19.8% |