Immigrants from Middle Africa vs Cypriot Male Disability
COMPARE
Immigrants from Middle Africa
Cypriot
Male Disability
Male Disability Comparison
Immigrants from Middle Africa
Cypriots
11.1%
MALE DISABILITY
70.9/ 100
METRIC RATING
155th/ 347
METRIC RANK
10.0%
MALE DISABILITY
100.0/ 100
METRIC RATING
23rd/ 347
METRIC RANK
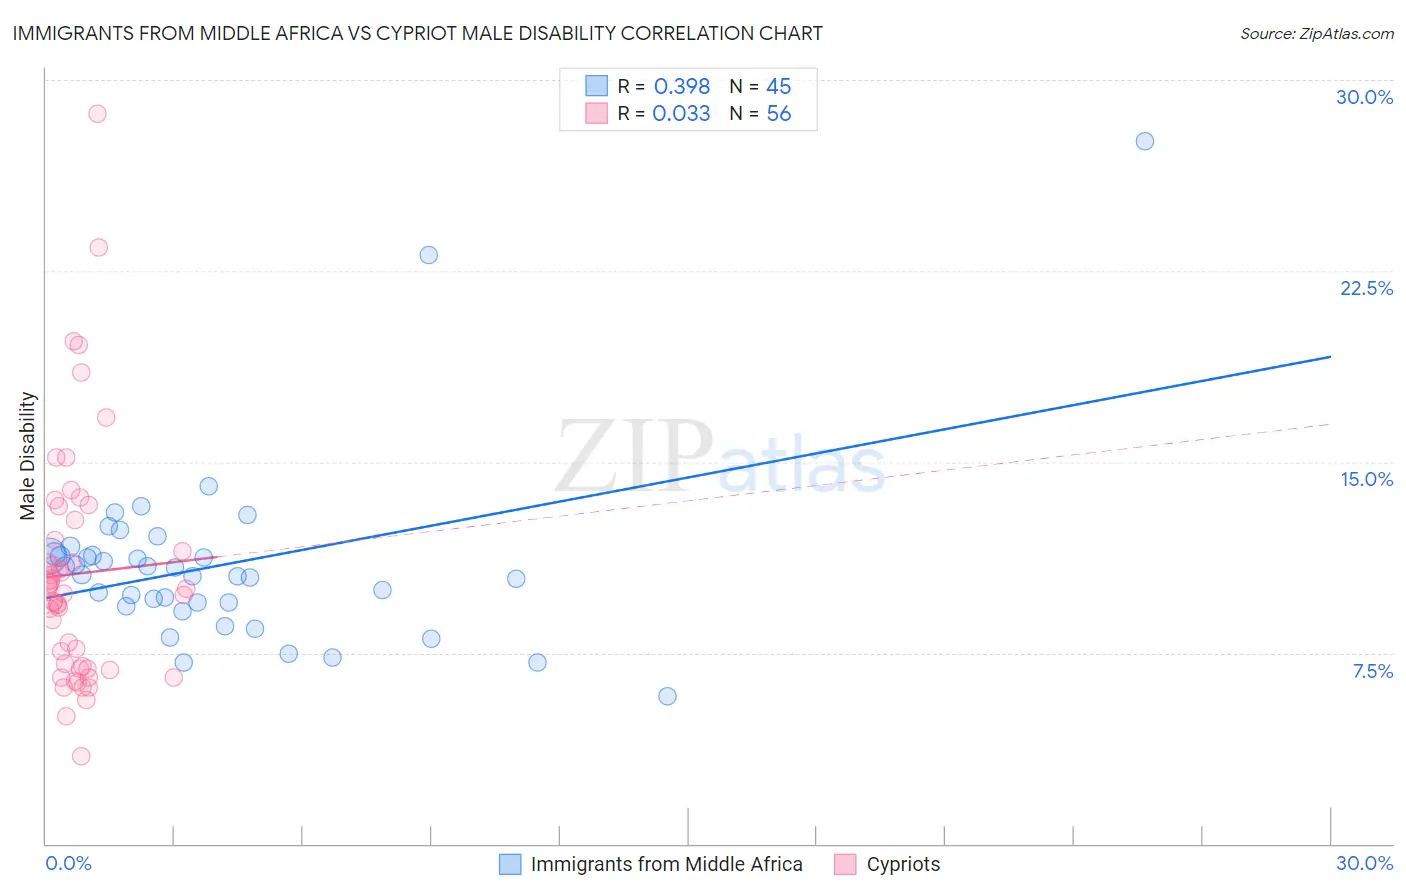
Immigrants from Middle Africa vs Cypriot Male Disability Correlation Chart
The statistical analysis conducted on geographies consisting of 202,727,084 people shows a mild positive correlation between the proportion of Immigrants from Middle Africa and percentage of males with a disability in the United States with a correlation coefficient (R) of 0.398 and weighted average of 11.1%. Similarly, the statistical analysis conducted on geographies consisting of 61,868,977 people shows no correlation between the proportion of Cypriots and percentage of males with a disability in the United States with a correlation coefficient (R) of 0.033 and weighted average of 10.0%, a difference of 10.6%.
Male Disability Correlation Summary
| Measurement | Immigrants from Middle Africa | Cypriot |
| Minimum | 5.8% | 3.4% |
| Maximum | 27.6% | 28.7% |
| Range | 21.8% | 25.3% |
| Mean | 11.0% | 10.6% |
| Median | 10.5% | 9.9% |
| Interquartile 25% (IQ1) | 9.4% | 6.9% |
| Interquartile 75% (IQ3) | 11.3% | 12.3% |
| Interquartile Range (IQR) | 1.9% | 5.4% |
| Standard Deviation (Sample) | 3.6% | 4.7% |
| Standard Deviation (Population) | 3.6% | 4.6% |
Similar Demographics by Male Disability
Demographics Similar to Immigrants from Middle Africa by Male Disability
In terms of male disability, the demographic groups most similar to Immigrants from Middle Africa are Russian (11.1%, a difference of 0.070%), Immigrants from Western Africa (11.1%, a difference of 0.11%), Immigrants from Moldova (11.1%, a difference of 0.14%), Immigrants from Northern Europe (11.1%, a difference of 0.16%), and Latvian (11.1%, a difference of 0.18%).
| Demographics | Rating | Rank | Male Disability |
| Sudanese | 77.1 /100 | #148 | Good 11.0% |
| Immigrants | Denmark | 76.4 /100 | #149 | Good 11.0% |
| Immigrants | Guatemala | 75.1 /100 | #150 | Good 11.0% |
| Cubans | 74.9 /100 | #151 | Good 11.0% |
| Immigrants | Albania | 74.4 /100 | #152 | Good 11.0% |
| Immigrants | Northern Europe | 73.2 /100 | #153 | Good 11.1% |
| Immigrants | Moldova | 72.8 /100 | #154 | Good 11.1% |
| Immigrants | Middle Africa | 70.9 /100 | #155 | Good 11.1% |
| Russians | 69.8 /100 | #156 | Good 11.1% |
| Immigrants | Western Africa | 69.2 /100 | #157 | Good 11.1% |
| Latvians | 68.1 /100 | #158 | Good 11.1% |
| Guatemalans | 67.2 /100 | #159 | Good 11.1% |
| Albanians | 66.5 /100 | #160 | Good 11.1% |
| Immigrants | West Indies | 65.7 /100 | #161 | Good 11.1% |
| Immigrants | Haiti | 65.3 /100 | #162 | Good 11.1% |
Demographics Similar to Cypriots by Male Disability
In terms of male disability, the demographic groups most similar to Cypriots are Immigrants from Venezuela (10.0%, a difference of 0.090%), Immigrants from Asia (10.0%, a difference of 0.14%), Immigrants from Malaysia (10.0%, a difference of 0.32%), Burmese (10.0%, a difference of 0.38%), and Paraguayan (10.1%, a difference of 0.45%).
| Demographics | Rating | Rank | Male Disability |
| Okinawans | 100.0 /100 | #16 | Exceptional 9.8% |
| Immigrants | Korea | 100.0 /100 | #17 | Exceptional 9.8% |
| Immigrants | Pakistan | 100.0 /100 | #18 | Exceptional 9.8% |
| Immigrants | Sri Lanka | 100.0 /100 | #19 | Exceptional 10.0% |
| Asians | 100.0 /100 | #20 | Exceptional 10.0% |
| Burmese | 100.0 /100 | #21 | Exceptional 10.0% |
| Immigrants | Venezuela | 100.0 /100 | #22 | Exceptional 10.0% |
| Cypriots | 100.0 /100 | #23 | Exceptional 10.0% |
| Immigrants | Asia | 100.0 /100 | #24 | Exceptional 10.0% |
| Immigrants | Malaysia | 99.9 /100 | #25 | Exceptional 10.0% |
| Paraguayans | 99.9 /100 | #26 | Exceptional 10.1% |
| Egyptians | 99.9 /100 | #27 | Exceptional 10.1% |
| Vietnamese | 99.9 /100 | #28 | Exceptional 10.1% |
| Venezuelans | 99.9 /100 | #29 | Exceptional 10.1% |
| Immigrants | Egypt | 99.9 /100 | #30 | Exceptional 10.1% |