Yaqui vs Immigrants from Japan Vision Disability
COMPARE
Yaqui
Immigrants from Japan
Vision Disability
Vision Disability Comparison
Yaqui
Immigrants from Japan
2.5%
VISION DISABILITY
0.0/ 100
METRIC RATING
293rd/ 347
METRIC RANK
1.9%
VISION DISABILITY
99.9/ 100
METRIC RATING
26th/ 347
METRIC RANK
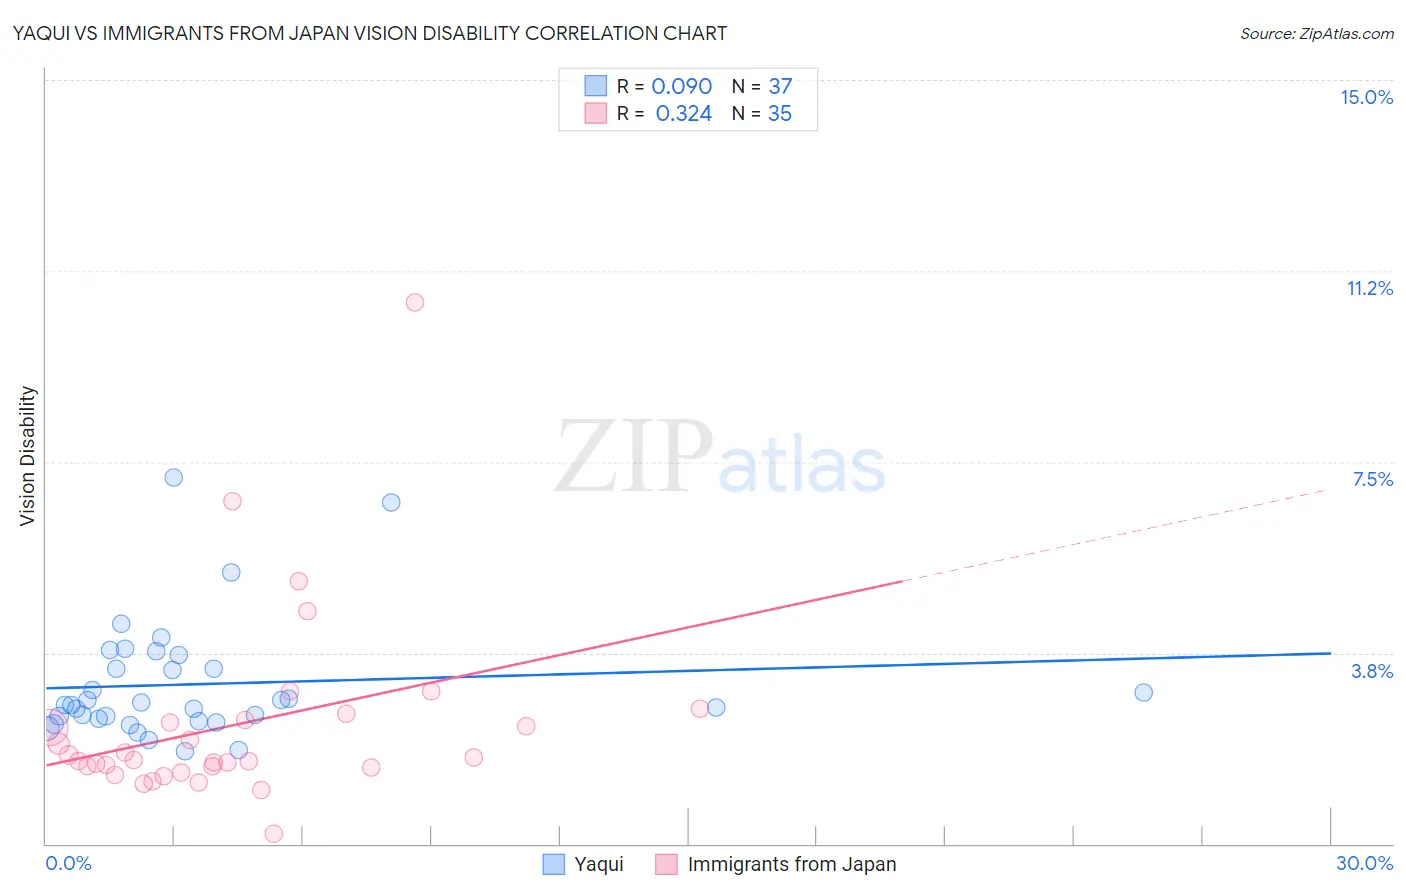
Yaqui vs Immigrants from Japan Vision Disability Correlation Chart
The statistical analysis conducted on geographies consisting of 107,692,151 people shows a slight positive correlation between the proportion of Yaqui and percentage of population with vision disability in the United States with a correlation coefficient (R) of 0.090 and weighted average of 2.5%. Similarly, the statistical analysis conducted on geographies consisting of 339,950,646 people shows a mild positive correlation between the proportion of Immigrants from Japan and percentage of population with vision disability in the United States with a correlation coefficient (R) of 0.324 and weighted average of 1.9%, a difference of 29.9%.
Vision Disability Correlation Summary
| Measurement | Yaqui | Immigrants from Japan |
| Minimum | 1.8% | 0.20% |
| Maximum | 7.2% | 10.6% |
| Range | 5.4% | 10.4% |
| Mean | 3.1% | 2.3% |
| Median | 2.7% | 1.6% |
| Interquartile 25% (IQ1) | 2.4% | 1.5% |
| Interquartile 75% (IQ3) | 3.6% | 2.4% |
| Interquartile Range (IQR) | 1.1% | 0.92% |
| Standard Deviation (Sample) | 1.2% | 1.9% |
| Standard Deviation (Population) | 1.2% | 1.9% |
Similar Demographics by Vision Disability
Demographics Similar to Yaqui by Vision Disability
In terms of vision disability, the demographic groups most similar to Yaqui are Crow (2.5%, a difference of 0.030%), Immigrants from Honduras (2.5%, a difference of 0.12%), Ottawa (2.5%, a difference of 0.34%), Immigrants from Cuba (2.5%, a difference of 0.52%), and Delaware (2.5%, a difference of 0.55%).
| Demographics | Rating | Rank | Vision Disability |
| Sioux | 0.0 /100 | #286 | Tragic 2.5% |
| Hondurans | 0.0 /100 | #287 | Tragic 2.5% |
| French American Indians | 0.0 /100 | #288 | Tragic 2.5% |
| Immigrants | Nonimmigrants | 0.0 /100 | #289 | Tragic 2.5% |
| Immigrants | Cuba | 0.0 /100 | #290 | Tragic 2.5% |
| Immigrants | Honduras | 0.0 /100 | #291 | Tragic 2.5% |
| Crow | 0.0 /100 | #292 | Tragic 2.5% |
| Yaqui | 0.0 /100 | #293 | Tragic 2.5% |
| Ottawa | 0.0 /100 | #294 | Tragic 2.5% |
| Delaware | 0.0 /100 | #295 | Tragic 2.5% |
| Immigrants | Mexico | 0.0 /100 | #296 | Tragic 2.5% |
| Immigrants | Dominica | 0.0 /100 | #297 | Tragic 2.5% |
| Mexicans | 0.0 /100 | #298 | Tragic 2.5% |
| Cree | 0.0 /100 | #299 | Tragic 2.5% |
| Africans | 0.0 /100 | #300 | Tragic 2.5% |
Demographics Similar to Immigrants from Japan by Vision Disability
In terms of vision disability, the demographic groups most similar to Immigrants from Japan are Bulgarian (1.9%, a difference of 0.040%), Immigrants from Lithuania (1.9%, a difference of 0.080%), Immigrants from Asia (1.9%, a difference of 0.20%), Taiwanese (1.9%, a difference of 0.34%), and Immigrants from Malaysia (1.9%, a difference of 0.36%).
| Demographics | Rating | Rank | Vision Disability |
| Immigrants | Sri Lanka | 100.0 /100 | #19 | Exceptional 1.9% |
| Asians | 100.0 /100 | #20 | Exceptional 1.9% |
| Turks | 100.0 /100 | #21 | Exceptional 1.9% |
| Immigrants | Pakistan | 100.0 /100 | #22 | Exceptional 1.9% |
| Immigrants | Asia | 99.9 /100 | #23 | Exceptional 1.9% |
| Immigrants | Lithuania | 99.9 /100 | #24 | Exceptional 1.9% |
| Bulgarians | 99.9 /100 | #25 | Exceptional 1.9% |
| Immigrants | Japan | 99.9 /100 | #26 | Exceptional 1.9% |
| Taiwanese | 99.9 /100 | #27 | Exceptional 1.9% |
| Immigrants | Malaysia | 99.9 /100 | #28 | Exceptional 1.9% |
| Egyptians | 99.9 /100 | #29 | Exceptional 1.9% |
| Immigrants | Nepal | 99.9 /100 | #30 | Exceptional 1.9% |
| Mongolians | 99.9 /100 | #31 | Exceptional 1.9% |
| Luxembourgers | 99.9 /100 | #32 | Exceptional 1.9% |
| Immigrants | Egypt | 99.9 /100 | #33 | Exceptional 1.9% |