Yakama vs Dutch West Indian Disability Age Under 5
COMPARE
Yakama
Dutch West Indian
Disability Age Under 5
Disability Age Under 5 Comparison
Yakama
Dutch West Indians
1.00%
DISABILITY AGE UNDER 5
100.0/ 100
METRIC RATING
23rd/ 347
METRIC RANK
1.9%
DISABILITY AGE UNDER 5
0.0/ 100
METRIC RATING
333rd/ 347
METRIC RANK
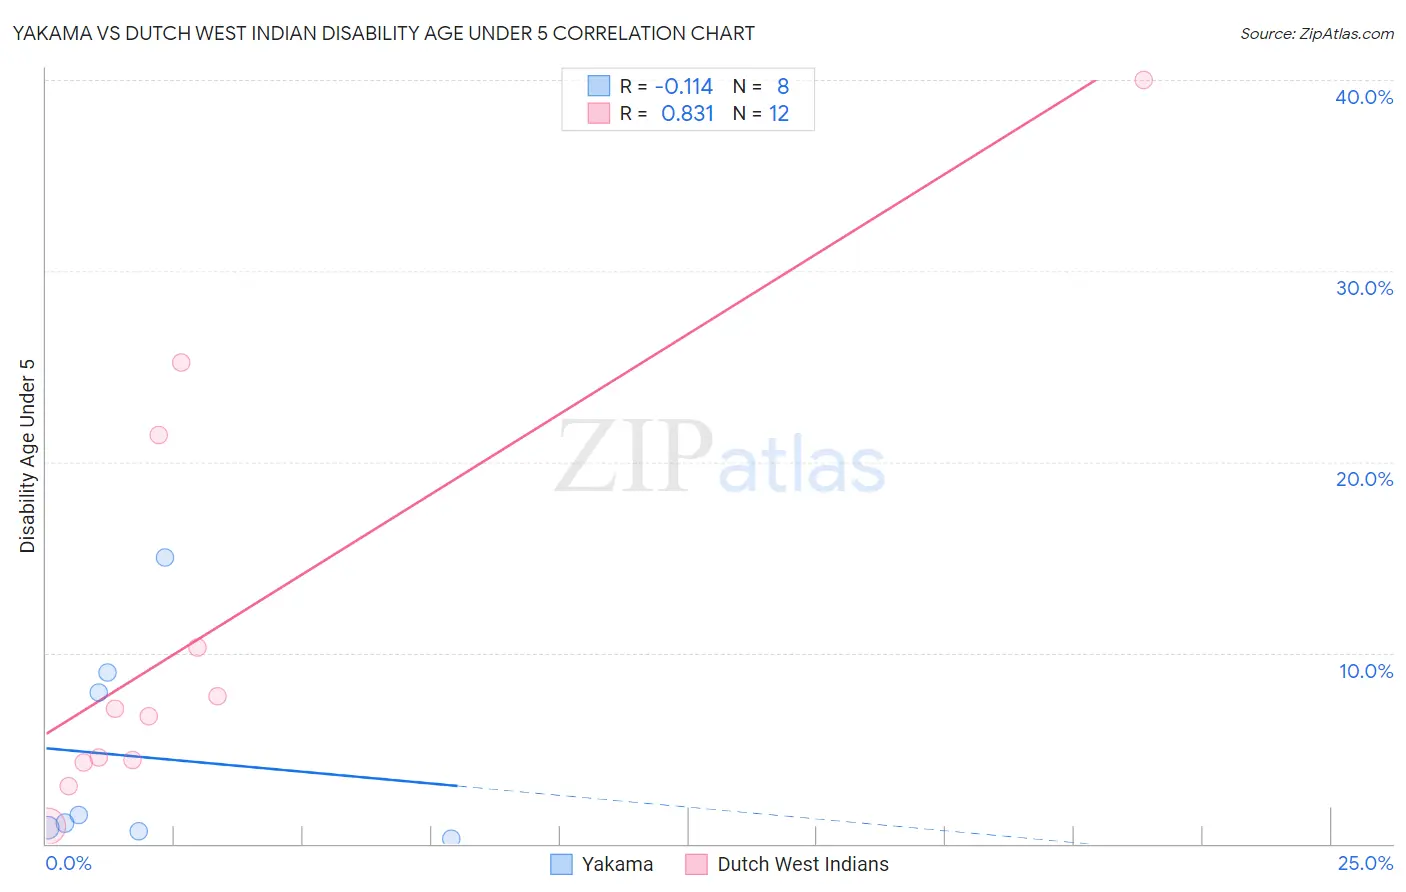
Yakama vs Dutch West Indian Disability Age Under 5 Correlation Chart
The statistical analysis conducted on geographies consisting of 15,694,723 people shows a poor negative correlation between the proportion of Yakama and percentage of population with a disability under the age of 5 in the United States with a correlation coefficient (R) of -0.114 and weighted average of 1.00%. Similarly, the statistical analysis conducted on geographies consisting of 63,691,358 people shows a very strong positive correlation between the proportion of Dutch West Indians and percentage of population with a disability under the age of 5 in the United States with a correlation coefficient (R) of 0.831 and weighted average of 1.9%, a difference of 93.6%.
Disability Age Under 5 Correlation Summary
| Measurement | Yakama | Dutch West Indian |
| Minimum | 0.27% | 0.90% |
| Maximum | 15.0% | 40.0% |
| Range | 14.7% | 39.1% |
| Mean | 4.5% | 11.3% |
| Median | 1.3% | 6.9% |
| Interquartile 25% (IQ1) | 0.74% | 4.3% |
| Interquartile 75% (IQ3) | 8.4% | 15.9% |
| Interquartile Range (IQR) | 7.7% | 11.5% |
| Standard Deviation (Sample) | 5.5% | 11.6% |
| Standard Deviation (Population) | 5.1% | 11.2% |
Similar Demographics by Disability Age Under 5
Demographics Similar to Yakama by Disability Age Under 5
In terms of disability age under 5, the demographic groups most similar to Yakama are Immigrants from Iran (1.00%, a difference of 0.080%), Indian (Asian) (1.0%, a difference of 0.28%), Immigrants from Micronesia (1.0%, a difference of 0.59%), Immigrants from Taiwan (1.0%, a difference of 0.72%), and British West Indian (0.99%, a difference of 0.87%).
| Demographics | Rating | Rank | Disability Age Under 5 |
| Immigrants | Israel | 100.0 /100 | #16 | Exceptional 0.96% |
| Immigrants | China | 100.0 /100 | #17 | Exceptional 0.96% |
| Immigrants | Barbados | 100.0 /100 | #18 | Exceptional 0.97% |
| Puget Sound Salish | 100.0 /100 | #19 | Exceptional 0.97% |
| Nepalese | 100.0 /100 | #20 | Exceptional 0.97% |
| British West Indians | 100.0 /100 | #21 | Exceptional 0.99% |
| Immigrants | Iran | 100.0 /100 | #22 | Exceptional 1.00% |
| Yakama | 100.0 /100 | #23 | Exceptional 1.00% |
| Indians (Asian) | 100.0 /100 | #24 | Exceptional 1.0% |
| Immigrants | Micronesia | 100.0 /100 | #25 | Exceptional 1.0% |
| Immigrants | Taiwan | 100.0 /100 | #26 | Exceptional 1.0% |
| Guyanese | 100.0 /100 | #27 | Exceptional 1.0% |
| Immigrants | Eastern Asia | 100.0 /100 | #28 | Exceptional 1.0% |
| Immigrants | Belarus | 100.0 /100 | #29 | Exceptional 1.0% |
| Immigrants | South Central Asia | 99.9 /100 | #30 | Exceptional 1.0% |
Demographics Similar to Dutch West Indians by Disability Age Under 5
In terms of disability age under 5, the demographic groups most similar to Dutch West Indians are Native/Alaskan (1.9%, a difference of 0.40%), Pennsylvania German (1.9%, a difference of 0.78%), Paraguayan (2.0%, a difference of 2.1%), Chippewa (1.9%, a difference of 2.9%), and French Canadian (1.9%, a difference of 3.0%).
| Demographics | Rating | Rank | Disability Age Under 5 |
| Sioux | 0.0 /100 | #326 | Tragic 1.8% |
| Osage | 0.0 /100 | #327 | Tragic 1.8% |
| Americans | 0.0 /100 | #328 | Tragic 1.9% |
| Houma | 0.0 /100 | #329 | Tragic 1.9% |
| Choctaw | 0.0 /100 | #330 | Tragic 1.9% |
| French Canadians | 0.0 /100 | #331 | Tragic 1.9% |
| Chippewa | 0.0 /100 | #332 | Tragic 1.9% |
| Dutch West Indians | 0.0 /100 | #333 | Tragic 1.9% |
| Natives/Alaskans | 0.0 /100 | #334 | Tragic 1.9% |
| Pennsylvania Germans | 0.0 /100 | #335 | Tragic 1.9% |
| Paraguayans | 0.0 /100 | #336 | Tragic 2.0% |
| Apache | 0.0 /100 | #337 | Tragic 2.0% |
| Tohono O'odham | 0.0 /100 | #338 | Tragic 2.2% |
| Immigrants | Azores | 0.0 /100 | #339 | Tragic 2.2% |
| Menominee | 0.0 /100 | #340 | Tragic 2.3% |