New Zealander vs European Disability
COMPARE
New Zealander
European
Disability
Disability Comparison
New Zealanders
Europeans
11.5%
DISABILITY
87.0/ 100
METRIC RATING
138th/ 347
METRIC RANK
12.3%
DISABILITY
1.4/ 100
METRIC RATING
251st/ 347
METRIC RANK
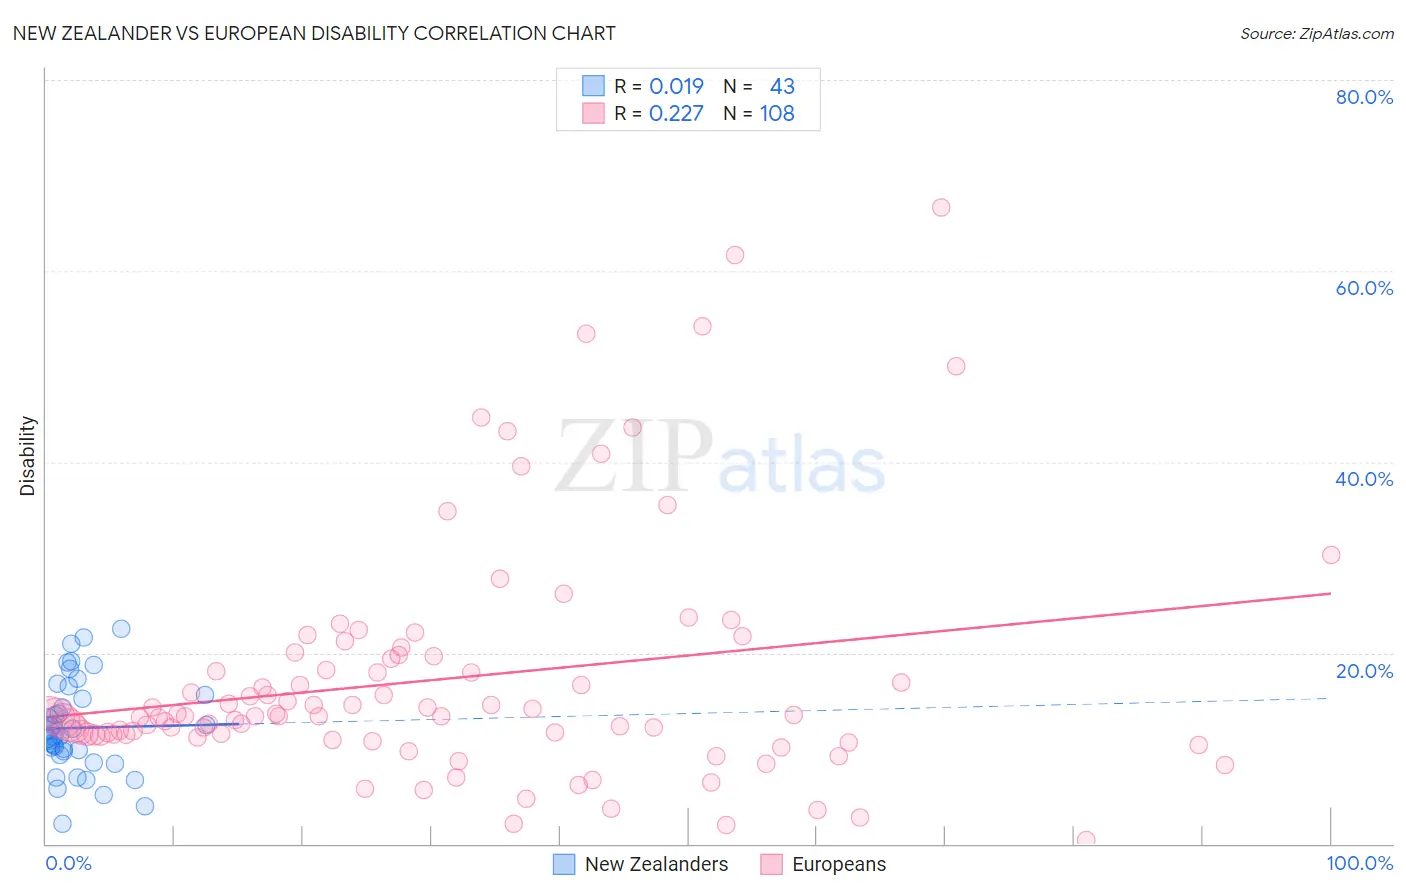
New Zealander vs European Disability Correlation Chart
The statistical analysis conducted on geographies consisting of 106,922,705 people shows no correlation between the proportion of New Zealanders and percentage of population with a disability in the United States with a correlation coefficient (R) of 0.019 and weighted average of 11.5%. Similarly, the statistical analysis conducted on geographies consisting of 561,707,574 people shows a weak positive correlation between the proportion of Europeans and percentage of population with a disability in the United States with a correlation coefficient (R) of 0.227 and weighted average of 12.3%, a difference of 7.0%.
Disability Correlation Summary
| Measurement | New Zealander | European |
| Minimum | 2.1% | 0.41% |
| Maximum | 22.5% | 66.7% |
| Range | 20.4% | 66.3% |
| Mean | 12.1% | 17.2% |
| Median | 11.3% | 13.4% |
| Interquartile 25% (IQ1) | 9.2% | 11.4% |
| Interquartile 75% (IQ3) | 15.6% | 19.6% |
| Interquartile Range (IQR) | 6.4% | 8.1% |
| Standard Deviation (Sample) | 4.9% | 12.4% |
| Standard Deviation (Population) | 4.8% | 12.3% |
Similar Demographics by Disability
Demographics Similar to New Zealanders by Disability
In terms of disability, the demographic groups most similar to New Zealanders are Ghanaian (11.5%, a difference of 0.0%), Kenyan (11.5%, a difference of 0.010%), Russian (11.5%, a difference of 0.020%), Immigrants from St. Vincent and the Grenadines (11.4%, a difference of 0.080%), and Ugandan (11.4%, a difference of 0.090%).
| Demographics | Rating | Rank | Disability |
| Immigrants | Croatia | 89.8 /100 | #131 | Excellent 11.4% |
| Immigrants | Africa | 89.3 /100 | #132 | Excellent 11.4% |
| Arabs | 89.1 /100 | #133 | Excellent 11.4% |
| Immigrants | Guyana | 88.3 /100 | #134 | Excellent 11.4% |
| Ugandans | 87.9 /100 | #135 | Excellent 11.4% |
| Immigrants | St. Vincent and the Grenadines | 87.8 /100 | #136 | Excellent 11.4% |
| Kenyans | 87.1 /100 | #137 | Excellent 11.5% |
| New Zealanders | 87.0 /100 | #138 | Excellent 11.5% |
| Ghanaians | 87.0 /100 | #139 | Excellent 11.5% |
| Russians | 86.8 /100 | #140 | Excellent 11.5% |
| Immigrants | Grenada | 86.1 /100 | #141 | Excellent 11.5% |
| Immigrants | Sudan | 85.3 /100 | #142 | Excellent 11.5% |
| Moroccans | 83.3 /100 | #143 | Excellent 11.5% |
| Australians | 82.5 /100 | #144 | Excellent 11.5% |
| Nigerians | 81.3 /100 | #145 | Excellent 11.5% |
Demographics Similar to Europeans by Disability
In terms of disability, the demographic groups most similar to Europeans are Subsaharan African (12.3%, a difference of 0.0%), Carpatho Rusyn (12.3%, a difference of 0.010%), Guamanian/Chamorro (12.3%, a difference of 0.020%), Indonesian (12.2%, a difference of 0.060%), and Swiss (12.2%, a difference of 0.090%).
| Demographics | Rating | Rank | Disability |
| Basques | 1.5 /100 | #244 | Tragic 12.2% |
| Liberians | 1.5 /100 | #245 | Tragic 12.2% |
| Swiss | 1.5 /100 | #246 | Tragic 12.2% |
| Indonesians | 1.4 /100 | #247 | Tragic 12.2% |
| Guamanians/Chamorros | 1.4 /100 | #248 | Tragic 12.3% |
| Carpatho Rusyns | 1.4 /100 | #249 | Tragic 12.3% |
| Sub-Saharan Africans | 1.4 /100 | #250 | Tragic 12.3% |
| Europeans | 1.4 /100 | #251 | Tragic 12.3% |
| Bermudans | 1.1 /100 | #252 | Tragic 12.3% |
| Belgians | 0.8 /100 | #253 | Tragic 12.3% |
| German Russians | 0.8 /100 | #254 | Tragic 12.3% |
| Slovenes | 0.6 /100 | #255 | Tragic 12.4% |
| Immigrants | Dominica | 0.6 /100 | #256 | Tragic 12.4% |
| Immigrants | Laos | 0.5 /100 | #257 | Tragic 12.4% |
| Slavs | 0.5 /100 | #258 | Tragic 12.4% |