Iranian vs Tohono O'odham Disability Age 18 to 34
COMPARE
Iranian
Tohono O'odham
Disability Age 18 to 34
Disability Age 18 to 34 Comparison
Iranians
Tohono O'odham
5.8%
DISABILITY AGE 18 TO 34
99.9/ 100
METRIC RATING
31st/ 347
METRIC RANK
7.3%
DISABILITY AGE 18 TO 34
0.2/ 100
METRIC RATING
260th/ 347
METRIC RANK
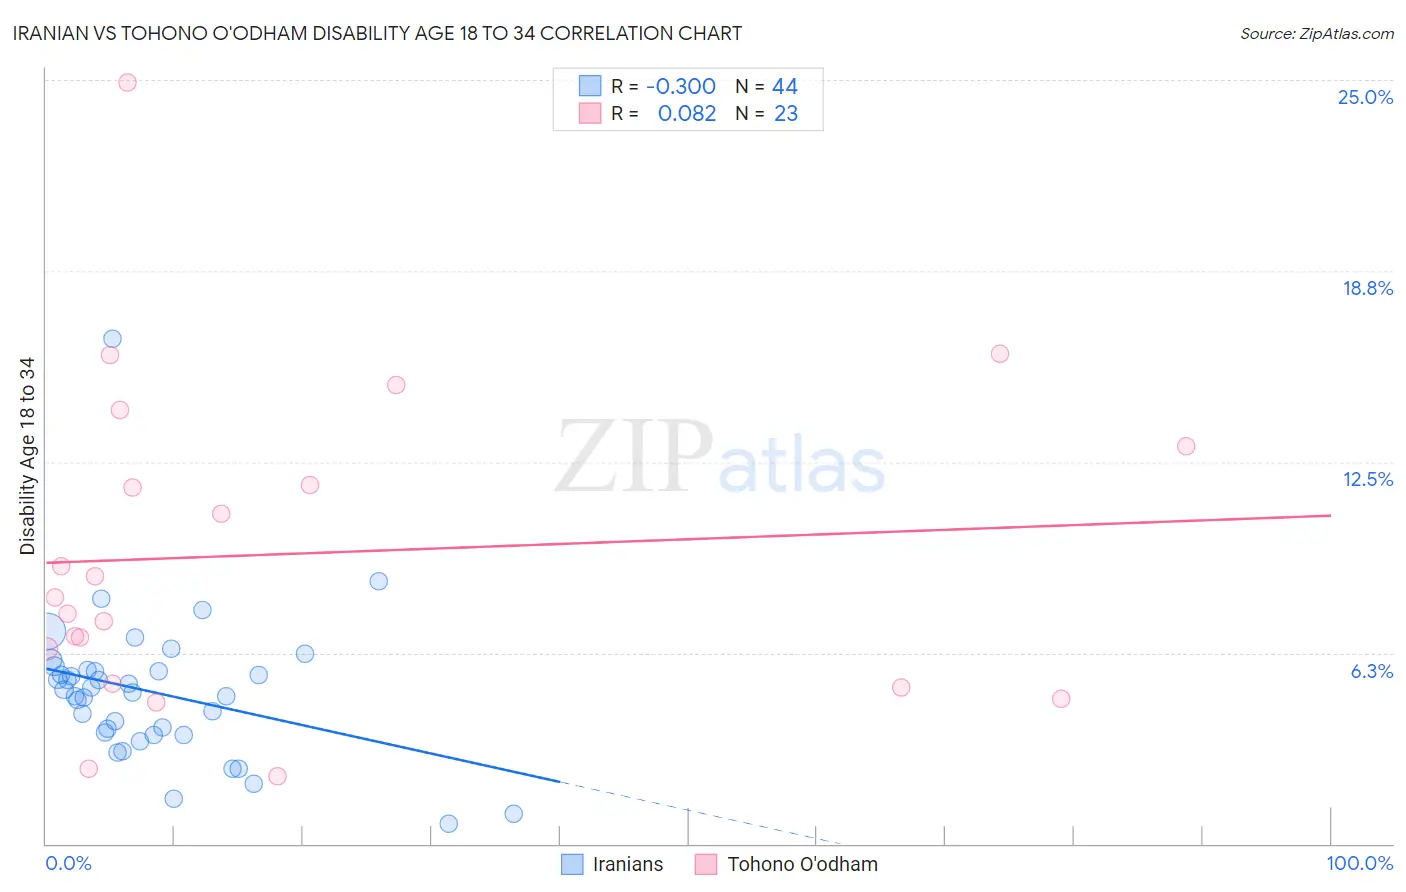
Iranian vs Tohono O'odham Disability Age 18 to 34 Correlation Chart
The statistical analysis conducted on geographies consisting of 316,452,778 people shows a weak negative correlation between the proportion of Iranians and percentage of population with a disability between the ages 18 and 35 in the United States with a correlation coefficient (R) of -0.300 and weighted average of 5.8%. Similarly, the statistical analysis conducted on geographies consisting of 58,690,000 people shows a slight positive correlation between the proportion of Tohono O'odham and percentage of population with a disability between the ages 18 and 35 in the United States with a correlation coefficient (R) of 0.082 and weighted average of 7.3%, a difference of 26.4%.
Disability Age 18 to 34 Correlation Summary
| Measurement | Iranian | Tohono O'odham |
| Minimum | 0.66% | 2.2% |
| Maximum | 16.5% | 24.9% |
| Range | 15.9% | 22.7% |
| Mean | 5.0% | 9.5% |
| Median | 5.0% | 8.1% |
| Interquartile 25% (IQ1) | 3.6% | 5.2% |
| Interquartile 75% (IQ3) | 5.7% | 13.0% |
| Interquartile Range (IQR) | 2.0% | 7.8% |
| Standard Deviation (Sample) | 2.5% | 5.3% |
| Standard Deviation (Population) | 2.5% | 5.2% |
Similar Demographics by Disability Age 18 to 34
Demographics Similar to Iranians by Disability Age 18 to 34
In terms of disability age 18 to 34, the demographic groups most similar to Iranians are Immigrants from Barbados (5.8%, a difference of 0.0%), Argentinean (5.8%, a difference of 0.020%), Venezuelan (5.8%, a difference of 0.21%), Immigrants from Pakistan (5.8%, a difference of 0.32%), and Immigrants from Lithuania (5.8%, a difference of 0.44%).
| Demographics | Rating | Rank | Disability Age 18 to 34 |
| Immigrants | Argentina | 100.0 /100 | #24 | Exceptional 5.7% |
| Immigrants | Singapore | 100.0 /100 | #25 | Exceptional 5.7% |
| Immigrants | Colombia | 100.0 /100 | #26 | Exceptional 5.7% |
| Immigrants | Venezuela | 99.9 /100 | #27 | Exceptional 5.7% |
| Soviet Union | 99.9 /100 | #28 | Exceptional 5.7% |
| Immigrants | Ecuador | 99.9 /100 | #29 | Exceptional 5.7% |
| Immigrants | Pakistan | 99.9 /100 | #30 | Exceptional 5.8% |
| Iranians | 99.9 /100 | #31 | Exceptional 5.8% |
| Immigrants | Barbados | 99.9 /100 | #32 | Exceptional 5.8% |
| Argentineans | 99.9 /100 | #33 | Exceptional 5.8% |
| Venezuelans | 99.9 /100 | #34 | Exceptional 5.8% |
| Immigrants | Lithuania | 99.9 /100 | #35 | Exceptional 5.8% |
| Ecuadorians | 99.9 /100 | #36 | Exceptional 5.8% |
| Armenians | 99.9 /100 | #37 | Exceptional 5.8% |
| Immigrants | South America | 99.9 /100 | #38 | Exceptional 5.8% |
Demographics Similar to Tohono O'odham by Disability Age 18 to 34
In terms of disability age 18 to 34, the demographic groups most similar to Tohono O'odham are Somali (7.3%, a difference of 0.060%), Immigrants from Micronesia (7.3%, a difference of 0.12%), Northern European (7.3%, a difference of 0.17%), Canadian (7.3%, a difference of 0.20%), and British (7.3%, a difference of 0.49%).
| Demographics | Rating | Rank | Disability Age 18 to 34 |
| Croatians | 0.5 /100 | #253 | Tragic 7.2% |
| Indonesians | 0.4 /100 | #254 | Tragic 7.2% |
| Immigrants | Germany | 0.4 /100 | #255 | Tragic 7.2% |
| Immigrants | Laos | 0.4 /100 | #256 | Tragic 7.2% |
| Czechs | 0.3 /100 | #257 | Tragic 7.2% |
| Immigrants | Micronesia | 0.3 /100 | #258 | Tragic 7.3% |
| Somalis | 0.2 /100 | #259 | Tragic 7.3% |
| Tohono O'odham | 0.2 /100 | #260 | Tragic 7.3% |
| Northern Europeans | 0.2 /100 | #261 | Tragic 7.3% |
| Canadians | 0.2 /100 | #262 | Tragic 7.3% |
| British | 0.2 /100 | #263 | Tragic 7.3% |
| Bermudans | 0.1 /100 | #264 | Tragic 7.3% |
| Slovenes | 0.1 /100 | #265 | Tragic 7.3% |
| German Russians | 0.1 /100 | #266 | Tragic 7.4% |
| Bangladeshis | 0.1 /100 | #267 | Tragic 7.4% |