Yakama vs Okinawan Disability Age 18 to 34
COMPARE
Yakama
Okinawan
Disability Age 18 to 34
Disability Age 18 to 34 Comparison
Yakama
Okinawans
9.0%
DISABILITY AGE 18 TO 34
0.0/ 100
METRIC RATING
342nd/ 347
METRIC RANK
5.9%
DISABILITY AGE 18 TO 34
99.7/ 100
METRIC RATING
52nd/ 347
METRIC RANK
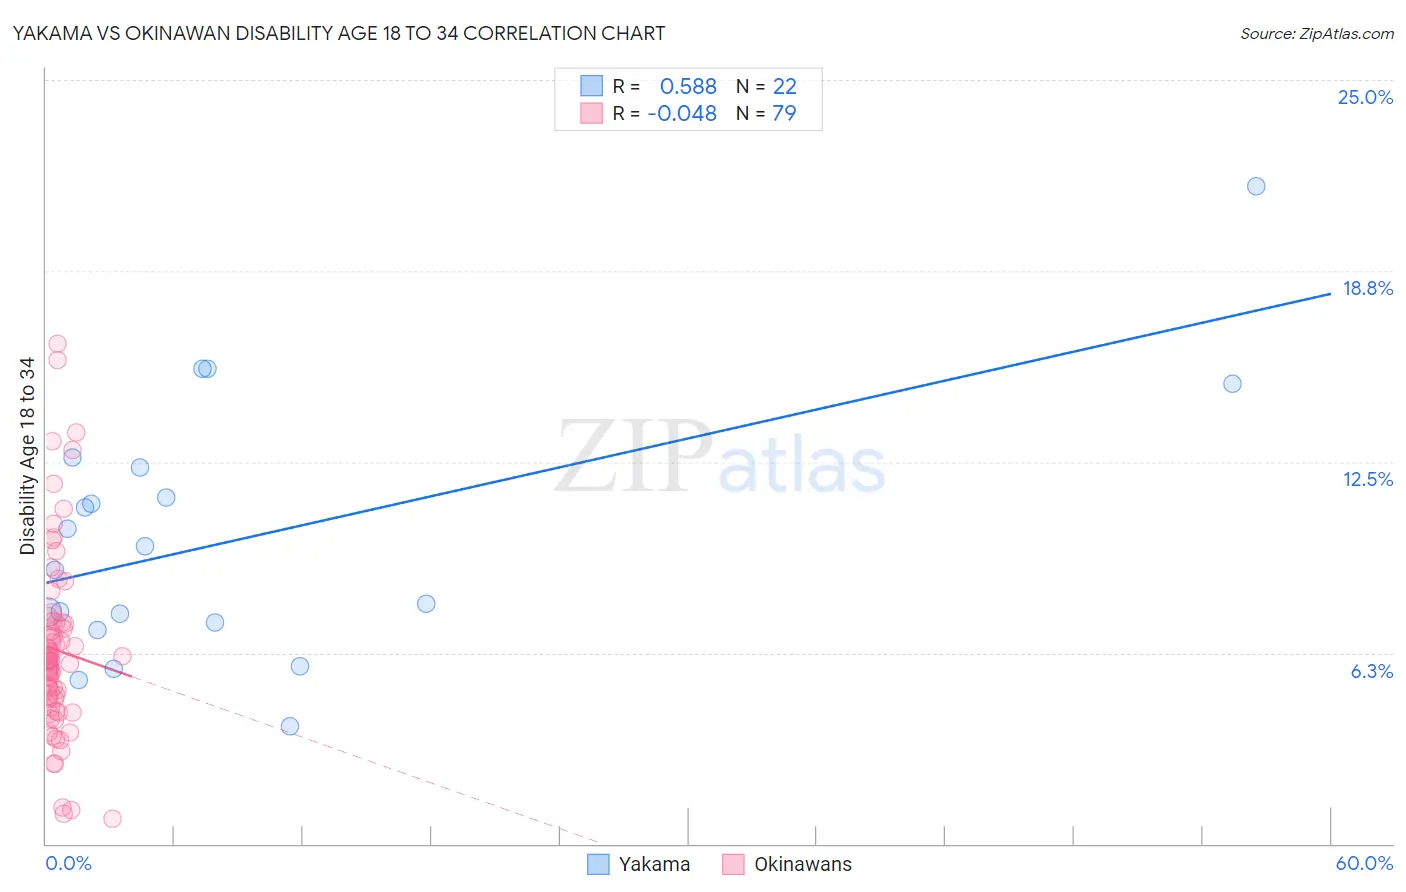
Yakama vs Okinawan Disability Age 18 to 34 Correlation Chart
The statistical analysis conducted on geographies consisting of 19,906,145 people shows a substantial positive correlation between the proportion of Yakama and percentage of population with a disability between the ages 18 and 35 in the United States with a correlation coefficient (R) of 0.588 and weighted average of 9.0%. Similarly, the statistical analysis conducted on geographies consisting of 73,761,709 people shows no correlation between the proportion of Okinawans and percentage of population with a disability between the ages 18 and 35 in the United States with a correlation coefficient (R) of -0.048 and weighted average of 5.9%, a difference of 51.7%.
Disability Age 18 to 34 Correlation Summary
| Measurement | Yakama | Okinawan |
| Minimum | 3.9% | 0.81% |
| Maximum | 21.5% | 16.4% |
| Range | 17.7% | 15.6% |
| Mean | 10.0% | 6.3% |
| Median | 9.3% | 6.0% |
| Interquartile 25% (IQ1) | 7.3% | 4.7% |
| Interquartile 75% (IQ3) | 12.3% | 7.3% |
| Interquartile Range (IQR) | 5.1% | 2.5% |
| Standard Deviation (Sample) | 4.2% | 3.0% |
| Standard Deviation (Population) | 4.1% | 3.0% |
Similar Demographics by Disability Age 18 to 34
Demographics Similar to Yakama by Disability Age 18 to 34
In terms of disability age 18 to 34, the demographic groups most similar to Yakama are Chippewa (9.0%, a difference of 0.010%), Chickasaw (9.0%, a difference of 0.050%), Choctaw (9.0%, a difference of 0.14%), Creek (9.0%, a difference of 0.39%), and Kiowa (8.8%, a difference of 1.6%).
| Demographics | Rating | Rank | Disability Age 18 to 34 |
| Apache | 0.0 /100 | #333 | Tragic 8.4% |
| Dutch West Indians | 0.0 /100 | #334 | Tragic 8.4% |
| Seminole | 0.0 /100 | #335 | Tragic 8.4% |
| Immigrants | Azores | 0.0 /100 | #336 | Tragic 8.5% |
| Ottawa | 0.0 /100 | #337 | Tragic 8.6% |
| Cherokee | 0.0 /100 | #338 | Tragic 8.7% |
| Kiowa | 0.0 /100 | #339 | Tragic 8.8% |
| Choctaw | 0.0 /100 | #340 | Tragic 9.0% |
| Chickasaw | 0.0 /100 | #341 | Tragic 9.0% |
| Yakama | 0.0 /100 | #342 | Tragic 9.0% |
| Chippewa | 0.0 /100 | #343 | Tragic 9.0% |
| Creek | 0.0 /100 | #344 | Tragic 9.0% |
| Alaskan Athabascans | 0.0 /100 | #345 | Tragic 9.4% |
| Houma | 0.0 /100 | #346 | Tragic 9.7% |
| Yuman | 0.0 /100 | #347 | Tragic 10.6% |
Demographics Similar to Okinawans by Disability Age 18 to 34
In terms of disability age 18 to 34, the demographic groups most similar to Okinawans are Egyptian (5.9%, a difference of 0.13%), Immigrants from El Salvador (5.9%, a difference of 0.14%), Immigrants from Indonesia (5.9%, a difference of 0.14%), Immigrants from Belarus (5.9%, a difference of 0.18%), and Immigrants from Malaysia (5.9%, a difference of 0.19%).
| Demographics | Rating | Rank | Disability Age 18 to 34 |
| Immigrants | Peru | 99.8 /100 | #45 | Exceptional 5.9% |
| Immigrants | Korea | 99.8 /100 | #46 | Exceptional 5.9% |
| Immigrants | Egypt | 99.8 /100 | #47 | Exceptional 5.9% |
| Immigrants | Trinidad and Tobago | 99.8 /100 | #48 | Exceptional 5.9% |
| Immigrants | Belarus | 99.8 /100 | #49 | Exceptional 5.9% |
| Immigrants | El Salvador | 99.8 /100 | #50 | Exceptional 5.9% |
| Egyptians | 99.8 /100 | #51 | Exceptional 5.9% |
| Okinawans | 99.7 /100 | #52 | Exceptional 5.9% |
| Immigrants | Indonesia | 99.7 /100 | #53 | Exceptional 5.9% |
| Immigrants | Malaysia | 99.7 /100 | #54 | Exceptional 5.9% |
| Immigrants | Spain | 99.7 /100 | #55 | Exceptional 5.9% |
| Paraguayans | 99.7 /100 | #56 | Exceptional 5.9% |
| Immigrants | Haiti | 99.7 /100 | #57 | Exceptional 5.9% |
| Immigrants | Serbia | 99.7 /100 | #58 | Exceptional 5.9% |
| Immigrants | Caribbean | 99.6 /100 | #59 | Exceptional 6.0% |