White/Caucasian vs Kiowa Female Disability
COMPARE
White/Caucasian
Kiowa
Female Disability
Female Disability Comparison
Whites/Caucasians
Kiowa
13.2%
FEMALE DISABILITY
0.0/ 100
METRIC RATING
288th/ 347
METRIC RANK
15.8%
FEMALE DISABILITY
0.0/ 100
METRIC RATING
344th/ 347
METRIC RANK
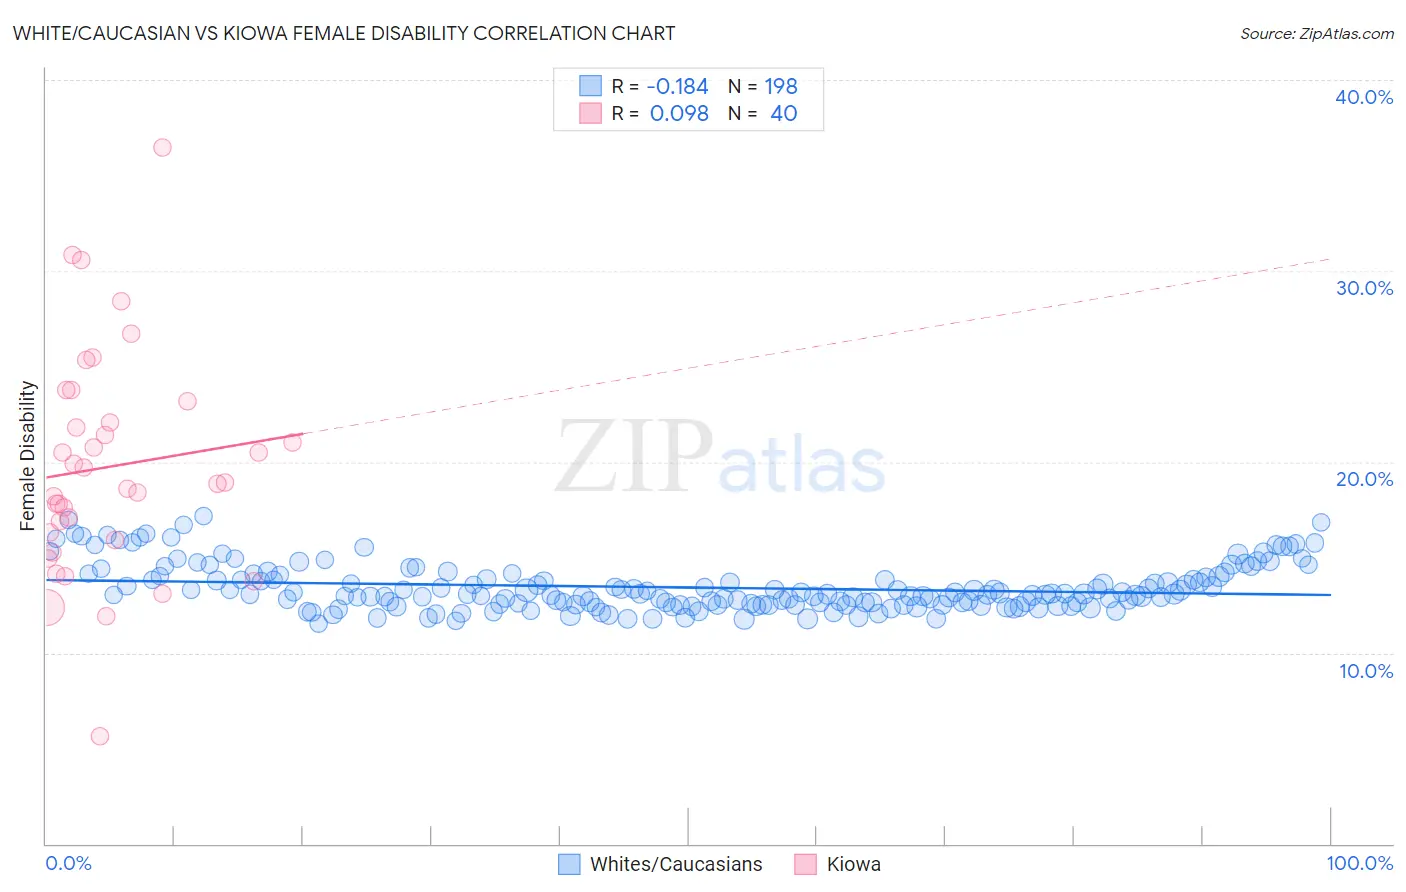
White/Caucasian vs Kiowa Female Disability Correlation Chart
The statistical analysis conducted on geographies consisting of 582,775,170 people shows a poor negative correlation between the proportion of Whites/Caucasians and percentage of females with a disability in the United States with a correlation coefficient (R) of -0.184 and weighted average of 13.2%. Similarly, the statistical analysis conducted on geographies consisting of 56,098,208 people shows a slight positive correlation between the proportion of Kiowa and percentage of females with a disability in the United States with a correlation coefficient (R) of 0.098 and weighted average of 15.8%, a difference of 19.8%.
Female Disability Correlation Summary
| Measurement | White/Caucasian | Kiowa |
| Minimum | 11.5% | 5.6% |
| Maximum | 17.2% | 36.4% |
| Range | 5.6% | 30.8% |
| Mean | 13.4% | 19.7% |
| Median | 13.1% | 18.9% |
| Interquartile 25% (IQ1) | 12.5% | 16.1% |
| Interquartile 75% (IQ3) | 14.0% | 22.6% |
| Interquartile Range (IQR) | 1.5% | 6.5% |
| Standard Deviation (Sample) | 1.2% | 5.8% |
| Standard Deviation (Population) | 1.2% | 5.8% |
Similar Demographics by Female Disability
Demographics Similar to Whites/Caucasians by Female Disability
In terms of female disability, the demographic groups most similar to Whites/Caucasians are Yaqui (13.2%, a difference of 0.10%), Tlingit-Haida (13.2%, a difference of 0.17%), Immigrants from Yemen (13.2%, a difference of 0.18%), Shoshone (13.2%, a difference of 0.24%), and Yakama (13.2%, a difference of 0.40%).
| Demographics | Rating | Rank | Female Disability |
| U.S. Virgin Islanders | 0.1 /100 | #281 | Tragic 13.1% |
| Welsh | 0.0 /100 | #282 | Tragic 13.1% |
| English | 0.0 /100 | #283 | Tragic 13.1% |
| Hmong | 0.0 /100 | #284 | Tragic 13.1% |
| Bangladeshis | 0.0 /100 | #285 | Tragic 13.1% |
| Fijians | 0.0 /100 | #286 | Tragic 13.1% |
| Yaqui | 0.0 /100 | #287 | Tragic 13.2% |
| Whites/Caucasians | 0.0 /100 | #288 | Tragic 13.2% |
| Tlingit-Haida | 0.0 /100 | #289 | Tragic 13.2% |
| Immigrants | Yemen | 0.0 /100 | #290 | Tragic 13.2% |
| Shoshone | 0.0 /100 | #291 | Tragic 13.2% |
| Yakama | 0.0 /100 | #292 | Tragic 13.2% |
| Marshallese | 0.0 /100 | #293 | Tragic 13.3% |
| Celtics | 0.0 /100 | #294 | Tragic 13.3% |
| French | 0.0 /100 | #295 | Tragic 13.3% |
Demographics Similar to Kiowa by Female Disability
In terms of female disability, the demographic groups most similar to Kiowa are Lumbee (15.8%, a difference of 0.16%), Creek (15.7%, a difference of 0.84%), Choctaw (15.4%, a difference of 2.5%), Chickasaw (15.2%, a difference of 3.9%), and Colville (15.1%, a difference of 4.8%).
| Demographics | Rating | Rank | Female Disability |
| Immigrants | Azores | 0.0 /100 | #333 | Tragic 14.9% |
| Cherokee | 0.0 /100 | #334 | Tragic 14.9% |
| Cajuns | 0.0 /100 | #335 | Tragic 14.9% |
| Seminole | 0.0 /100 | #336 | Tragic 15.0% |
| Tohono O'odham | 0.0 /100 | #337 | Tragic 15.0% |
| Dutch West Indians | 0.0 /100 | #338 | Tragic 15.0% |
| Colville | 0.0 /100 | #339 | Tragic 15.1% |
| Chickasaw | 0.0 /100 | #340 | Tragic 15.2% |
| Choctaw | 0.0 /100 | #341 | Tragic 15.4% |
| Creek | 0.0 /100 | #342 | Tragic 15.7% |
| Lumbee | 0.0 /100 | #343 | Tragic 15.8% |
| Kiowa | 0.0 /100 | #344 | Tragic 15.8% |
| Puerto Ricans | 0.0 /100 | #345 | Tragic 16.6% |
| Tsimshian | 0.0 /100 | #346 | Tragic 16.8% |
| Houma | 0.0 /100 | #347 | Tragic 16.9% |