White/Caucasian vs Immigrants from Brazil Female Disability

COMPARE

White/Caucasian
Race
Ancestry
AfghanAfricanAlaska NativeAlaskan AthabascanAlbanianAleutAlsatianAmericanApacheArabArapahoArgentineanArmenianAssyrian/Chaldean/SyriacAustralianAustrianBahamianBangladeshiBarbadianBasqueBelgianBelizeanBermudanBhutaneseBlackfeetBolivianBrazilianBritishBritish West IndianBulgarianBurmeseCajunCambodianCanadianCape VerdeanCarpatho RusynCelticCentral AmericanCentral American IndianCherokeeCheyenneChickasawChileanChineseChippewaChoctawColombianColvilleComancheCosta RicanCreeCreekCroatianCrowCubanCypriotCzechCzechoslovakianDanishDelawareDominicanDutchDutch West IndianEastern EuropeanEcuadorianEgyptianEnglishEstonianEthiopianEuropeanFijianFilipinoFinnishFrenchFrench American IndianFrench CanadianGermanGerman RussianGhanaianGreekGuamanian/ChamorroGuatemalanGuyaneseHaitianHmongHonduranHopiHoumaHungarianIcelanderIndian (Asian)IndonesianInupiatIranianIraqiIrishIroquoisIsraeliItalianJamaicanJapaneseJordanianKenyanKiowaKoreanLaotianLatvianLebaneseLiberianLithuanianLumbeeLuxembourgerMacedonianMalaysianMalteseMarshalleseMenomineeMexicanMexican American IndianMongolianMoroccanNative HawaiianNavajoNepaleseNew ZealanderNicaraguanNigerianNorthern EuropeanNorwegianOkinawanOsageOttawaPaiutePakistaniPalestinianPanamanianParaguayanPennsylvania GermanPeruvianPimaPolishPortuguesePotawatomiPuebloPuerto RicanPuget Sound SalishRomanianRussianSalvadoranSamoanScandinavianScotch-IrishScottishSeminoleSenegaleseSerbianShoshoneSierra LeoneanSiouxSlavicSlovakSloveneSomaliSouth AfricanSouth AmericanSouth American IndianSoviet UnionSpaniardSpanishSpanish AmericanSpanish American IndianSri LankanSubsaharan AfricanSudaneseSwedishSwissSyrianTaiwaneseThaiTlingit-HaidaTohono O'OdhamTonganTrinidadian and TobagonianTsimshianTurkishU.S. Virgin IslanderUgandanUkrainianUruguayanUteVenezuelanVietnameseWelshWest IndianYakamaYaquiYugoslavianYumanYup'ikZimbabwean
Immigration
NonimmigrantsImmigrantsAfghanistanAfricaAlbaniaArgentinaArmeniaAsiaAustraliaAustriaBahamasBangladeshBarbadosBelarusBelgiumBelizeBoliviaBosnia and HerzegovinaBulgariaBurma/MyanmarCabo VerdeCambodiaCameroonCanadaCaribbeanCentral AmericaChileChinaColombiaCongoCosta RicaCroatiaCubaCzechoslovakiaDenmarkDominicaDominican RepublicEastern AfricaEastern AsiaEastern EuropeEcuadorEgyptEl SalvadorEnglandEritreaEthiopiaEuropeFijiFranceGermanyGhanaGreeceGrenadaGuatemalaGuyanaHaitiHondurasHong KongHungaryIndiaIndonesiaIranIraqIrelandIsraelItalyJamaicaJapanJordanKazakhstanKenyaKoreaKuwaitLaosLatin AmericaLatviaLebanonLiberiaLithuaniaMalaysiaMexicoMicronesiaMiddle AfricaMoldovaMoroccoNepalNetherlandsNicaraguaNigeriaNorth AmericaNorth MacedoniaNorthern AfricaNorthern EuropeNorwayOceaniaPakistanPanamaPeruPhilippinesPolandPortugalRomaniaRussiaSaudi ArabiaScotlandSenegalSerbiaSierra LeoneSingaporeSomaliaSouth AfricaSouth AmericaSouth Central AsiaSouth Eastern AsiaSouthern EuropeSpainSri LankaSt. Vincent and the GrenadinesSudanSwedenSwitzerlandSyriaTaiwanThailandTrinidad and TobagoTurkeyUgandaUkraineUruguayUzbekistanVenezuelaVietnamWest IndiesWestern AfricaWestern AsiaWestern EuropeYemenZaireZimbabweAzores
Immigrants from Brazil
Race
Ancestry
AfghanAfricanAlaska NativeAlaskan AthabascanAlbanianAleutAlsatianAmericanApacheArabArapahoArgentineanArmenianAssyrian/Chaldean/SyriacAustralianAustrianBahamianBangladeshiBarbadianBasqueBelgianBelizeanBermudanBhutaneseBlackfeetBolivianBrazilianBritishBritish West IndianBulgarianBurmeseCajunCambodianCanadianCape VerdeanCarpatho RusynCelticCentral AmericanCentral American IndianCherokeeCheyenneChickasawChileanChineseChippewaChoctawColombianColvilleComancheCosta RicanCreeCreekCroatianCrowCubanCypriotCzechCzechoslovakianDanishDelawareDominicanDutchDutch West IndianEastern EuropeanEcuadorianEgyptianEnglishEstonianEthiopianEuropeanFijianFilipinoFinnishFrenchFrench American IndianFrench CanadianGermanGerman RussianGhanaianGreekGuamanian/ChamorroGuatemalanGuyaneseHaitianHmongHonduranHopiHoumaHungarianIcelanderIndian (Asian)IndonesianInupiatIranianIraqiIrishIroquoisIsraeliItalianJamaicanJapaneseJordanianKenyanKiowaKoreanLaotianLatvianLebaneseLiberianLithuanianLumbeeLuxembourgerMacedonianMalaysianMalteseMarshalleseMenomineeMexicanMexican American IndianMongolianMoroccanNative HawaiianNavajoNepaleseNew ZealanderNicaraguanNigerianNorthern EuropeanNorwegianOkinawanOsageOttawaPaiutePakistaniPalestinianPanamanianParaguayanPennsylvania GermanPeruvianPimaPolishPortuguesePotawatomiPuebloPuerto RicanPuget Sound SalishRomanianRussianSalvadoranSamoanScandinavianScotch-IrishScottishSeminoleSenegaleseSerbianShoshoneSierra LeoneanSiouxSlavicSlovakSloveneSomaliSouth AfricanSouth AmericanSouth American IndianSoviet UnionSpaniardSpanishSpanish AmericanSpanish American IndianSri LankanSubsaharan AfricanSudaneseSwedishSwissSyrianTaiwaneseThaiTlingit-HaidaTohono O'OdhamTonganTrinidadian and TobagonianTsimshianTurkishU.S. Virgin IslanderUgandanUkrainianUruguayanUteVenezuelanVietnameseWelshWest IndianYakamaYaquiYugoslavianYumanYup'ikZimbabwean
Immigration
NonimmigrantsImmigrantsAfghanistanAfricaAlbaniaArgentinaArmeniaAsiaAustraliaAustriaBahamasBangladeshBarbadosBelarusBelgiumBelizeBoliviaBosnia and HerzegovinaBrazilBulgariaBurma/MyanmarCabo VerdeCambodiaCameroonCanadaCaribbeanCentral AmericaChileChinaColombiaCongoCosta RicaCroatiaCubaCzechoslovakiaDenmarkDominicaDominican RepublicEastern AfricaEastern AsiaEastern EuropeEcuadorEgyptEl SalvadorEnglandEritreaEthiopiaEuropeFijiFranceGermanyGhanaGreeceGrenadaGuatemalaGuyanaHaitiHondurasHong KongHungaryIndiaIndonesiaIranIraqIrelandIsraelItalyJamaicaJapanJordanKazakhstanKenyaKoreaKuwaitLaosLatin AmericaLatviaLebanonLiberiaLithuaniaMalaysiaMexicoMicronesiaMiddle AfricaMoldovaMoroccoNepalNetherlandsNicaraguaNigeriaNorth AmericaNorth MacedoniaNorthern AfricaNorthern EuropeNorwayOceaniaPakistanPanamaPeruPhilippinesPolandPortugalRomaniaRussiaSaudi ArabiaScotlandSenegalSerbiaSierra LeoneSingaporeSomaliaSouth AfricaSouth AmericaSouth Central AsiaSouth Eastern AsiaSouthern EuropeSpainSri LankaSt. Vincent and the GrenadinesSudanSwedenSwitzerlandSyriaTaiwanThailandTrinidad and TobagoTurkeyUgandaUkraineUruguayUzbekistanVenezuelaVietnamWest IndiesWestern AfricaWestern AsiaWestern EuropeYemenZaireZimbabweAzores
Female Disability
Income
Poverty
Unemployment
Labor Participation
Family Structure
Vehicle Availability
Education Level
Disability

Female Disability Comparison

Whites/Caucasians

Immigrants from Brazil

Tragic
Exceptional
13.2%
FEMALE DISABILITY
0.0/ 100
METRIC RATING
288th/ 347
METRIC RANK
11.6%
FEMALE DISABILITY
99.4/ 100
METRIC RATING
94th/ 347
METRIC RANK

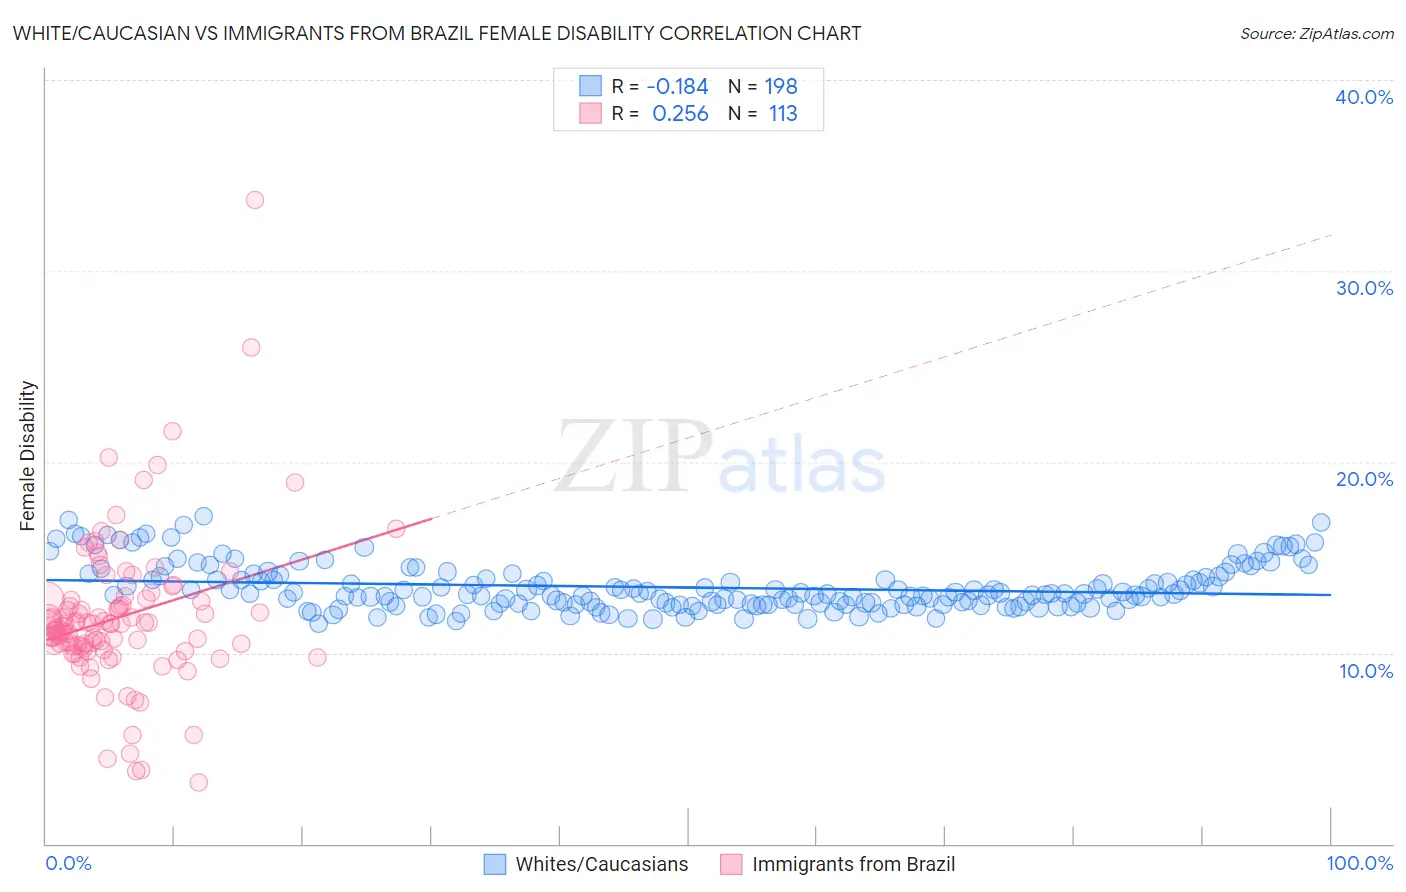
White/Caucasian vs Immigrants from Brazil Female Disability Correlation Chart

The statistical analysis conducted on geographies consisting of 582,775,170 people shows a poor negative correlation between the proportion of Whites/Caucasians and percentage of females with a disability in the United States with a correlation coefficient (R) of -0.184 and weighted average of 13.2%. Similarly, the statistical analysis conducted on geographies consisting of 343,005,923 people shows a weak positive correlation between the proportion of Immigrants from Brazil and percentage of females with a disability in the United States with a correlation coefficient (R) of 0.256 and weighted average of 11.6%, a difference of 13.6%.
White/Caucasian vs Immigrants from Brazil Female Disability

Female Disability Correlation Summary

MeasurementWhite/CaucasianImmigrants from Brazil
Minimum11.5%3.2%
Maximum17.2%33.7%
Range5.6%30.5%
Mean13.4%11.9%
Median13.1%11.5%
Interquartile 25% (IQ1)12.5%10.3%
Interquartile 75% (IQ3)14.0%12.8%
Interquartile Range (IQR)1.5%2.5%
Standard Deviation (Sample)1.2%4.0%
Standard Deviation (Population)1.2%4.0%

Similar Demographics by Female Disability

Demographics Similar to Whites/Caucasians by Female Disability

In terms of female disability, the demographic groups most similar to Whites/Caucasians are Yaqui (13.2%, a difference of 0.10%), Tlingit-Haida (13.2%, a difference of 0.17%), Immigrants from Yemen (13.2%, a difference of 0.18%), Shoshone (13.2%, a difference of 0.24%), and Yakama (13.2%, a difference of 0.40%).
DemographicsRating | RankFemale Disability
U.S. Virgin Islanders
0.1
/100
|
#281
Tragic
13.1%
Welsh
0.0
/100
|
#282
Tragic
13.1%
English
0.0
/100
|
#283
Tragic
13.1%
Hmong
0.0
/100
|
#284
Tragic
13.1%
Bangladeshis
0.0
/100
|
#285
Tragic
13.1%
Fijians
0.0
/100
|
#286
Tragic
13.1%
Yaqui
0.0
/100
|
#287
Tragic
13.2%
Whites/Caucasians
0.0
/100
|
#288
Tragic
13.2%
Tlingit-Haida
0.0
/100
|
#289
Tragic
13.2%
Immigrants | Yemen
0.0
/100
|
#290
Tragic
13.2%
Shoshone
0.0
/100
|
#291
Tragic
13.2%
Yakama
0.0
/100
|
#292
Tragic
13.2%
Marshallese
0.0
/100
|
#293
Tragic
13.3%
Celtics
0.0
/100
|
#294
Tragic
13.3%
French
0.0
/100
|
#295
Tragic
13.3%

Demographics Similar to Immigrants from Brazil by Female Disability

In terms of female disability, the demographic groups most similar to Immigrants from Brazil are Immigrants from Sierra Leone (11.6%, a difference of 0.030%), Immigrants from Northern Europe (11.6%, a difference of 0.070%), Immigrants from Zimbabwe (11.6%, a difference of 0.14%), Immigrants from Czechoslovakia (11.6%, a difference of 0.14%), and Immigrants from Romania (11.6%, a difference of 0.15%).
DemographicsRating | RankFemale Disability
Immigrants | Denmark
99.5
/100
|
#87
Exceptional
11.6%
Yup'ik
99.5
/100
|
#88
Exceptional
11.6%
Vietnamese
99.5
/100
|
#89
Exceptional
11.6%
Immigrants | Romania
99.5
/100
|
#90
Exceptional
11.6%
Immigrants | Zimbabwe
99.5
/100
|
#91
Exceptional
11.6%
Immigrants | Czechoslovakia
99.5
/100
|
#92
Exceptional
11.6%
Immigrants | Sierra Leone
99.4
/100
|
#93
Exceptional
11.6%
Immigrants | Brazil
99.4
/100
|
#94
Exceptional
11.6%
Immigrants | Northern Europe
99.4
/100
|
#95
Exceptional
11.6%
Immigrants | Russia
99.0
/100
|
#96
Exceptional
11.7%
Koreans
99.0
/100
|
#97
Exceptional
11.7%
Uruguayans
98.8
/100
|
#98
Exceptional
11.7%
Immigrants | Philippines
98.6
/100
|
#99
Exceptional
11.7%
Immigrants | Uruguay
98.5
/100
|
#100
Exceptional
11.7%
Immigrants | Costa Rica
98.4
/100
|
#101
Exceptional
11.7%