White/Caucasian vs Immigrants from Colombia Female Disability
COMPARE
White/Caucasian
Immigrants from Colombia
Female Disability
Female Disability Comparison
Whites/Caucasians
Immigrants from Colombia
13.2%
FEMALE DISABILITY
0.0/ 100
METRIC RATING
288th/ 347
METRIC RANK
11.4%
FEMALE DISABILITY
99.9/ 100
METRIC RATING
63rd/ 347
METRIC RANK
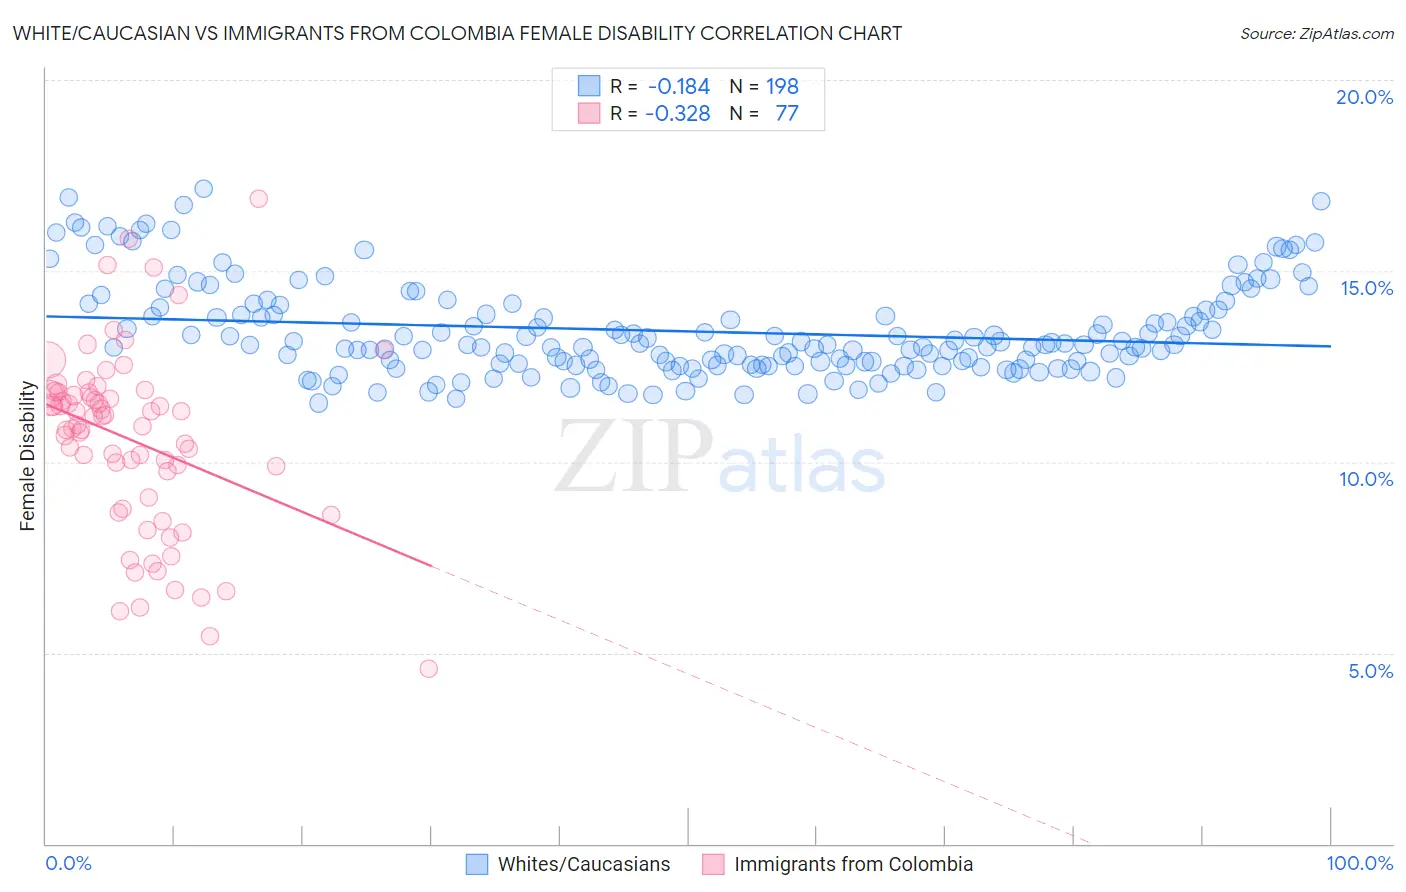
White/Caucasian vs Immigrants from Colombia Female Disability Correlation Chart
The statistical analysis conducted on geographies consisting of 582,775,170 people shows a poor negative correlation between the proportion of Whites/Caucasians and percentage of females with a disability in the United States with a correlation coefficient (R) of -0.184 and weighted average of 13.2%. Similarly, the statistical analysis conducted on geographies consisting of 378,634,617 people shows a mild negative correlation between the proportion of Immigrants from Colombia and percentage of females with a disability in the United States with a correlation coefficient (R) of -0.328 and weighted average of 11.4%, a difference of 15.3%.
Female Disability Correlation Summary
| Measurement | White/Caucasian | Immigrants from Colombia |
| Minimum | 11.5% | 4.6% |
| Maximum | 17.2% | 16.9% |
| Range | 5.6% | 12.3% |
| Mean | 13.4% | 10.6% |
| Median | 13.1% | 11.0% |
| Interquartile 25% (IQ1) | 12.5% | 8.9% |
| Interquartile 75% (IQ3) | 14.0% | 11.8% |
| Interquartile Range (IQR) | 1.5% | 2.9% |
| Standard Deviation (Sample) | 1.2% | 2.4% |
| Standard Deviation (Population) | 1.2% | 2.4% |
Similar Demographics by Female Disability
Demographics Similar to Whites/Caucasians by Female Disability
In terms of female disability, the demographic groups most similar to Whites/Caucasians are Yaqui (13.2%, a difference of 0.10%), Tlingit-Haida (13.2%, a difference of 0.17%), Immigrants from Yemen (13.2%, a difference of 0.18%), Shoshone (13.2%, a difference of 0.24%), and Yakama (13.2%, a difference of 0.40%).
| Demographics | Rating | Rank | Female Disability |
| U.S. Virgin Islanders | 0.1 /100 | #281 | Tragic 13.1% |
| Welsh | 0.0 /100 | #282 | Tragic 13.1% |
| English | 0.0 /100 | #283 | Tragic 13.1% |
| Hmong | 0.0 /100 | #284 | Tragic 13.1% |
| Bangladeshis | 0.0 /100 | #285 | Tragic 13.1% |
| Fijians | 0.0 /100 | #286 | Tragic 13.1% |
| Yaqui | 0.0 /100 | #287 | Tragic 13.2% |
| Whites/Caucasians | 0.0 /100 | #288 | Tragic 13.2% |
| Tlingit-Haida | 0.0 /100 | #289 | Tragic 13.2% |
| Immigrants | Yemen | 0.0 /100 | #290 | Tragic 13.2% |
| Shoshone | 0.0 /100 | #291 | Tragic 13.2% |
| Yakama | 0.0 /100 | #292 | Tragic 13.2% |
| Marshallese | 0.0 /100 | #293 | Tragic 13.3% |
| Celtics | 0.0 /100 | #294 | Tragic 13.3% |
| French | 0.0 /100 | #295 | Tragic 13.3% |
Demographics Similar to Immigrants from Colombia by Female Disability
In terms of female disability, the demographic groups most similar to Immigrants from Colombia are Immigrants from El Salvador (11.4%, a difference of 0.070%), Immigrants from South America (11.4%, a difference of 0.090%), Sri Lankan (11.4%, a difference of 0.10%), Immigrants from France (11.4%, a difference of 0.20%), and Immigrants from Bulgaria (11.4%, a difference of 0.26%).
| Demographics | Rating | Rank | Female Disability |
| Taiwanese | 99.9 /100 | #56 | Exceptional 11.4% |
| South Americans | 99.9 /100 | #57 | Exceptional 11.4% |
| Laotians | 99.9 /100 | #58 | Exceptional 11.4% |
| Immigrants | Spain | 99.9 /100 | #59 | Exceptional 11.4% |
| Immigrants | Bulgaria | 99.9 /100 | #60 | Exceptional 11.4% |
| Immigrants | France | 99.9 /100 | #61 | Exceptional 11.4% |
| Sri Lankans | 99.9 /100 | #62 | Exceptional 11.4% |
| Immigrants | Colombia | 99.9 /100 | #63 | Exceptional 11.4% |
| Immigrants | El Salvador | 99.9 /100 | #64 | Exceptional 11.4% |
| Immigrants | South America | 99.9 /100 | #65 | Exceptional 11.4% |
| Salvadorans | 99.8 /100 | #66 | Exceptional 11.5% |
| Immigrants | Vietnam | 99.8 /100 | #67 | Exceptional 11.5% |
| Immigrants | Northern Africa | 99.8 /100 | #68 | Exceptional 11.5% |
| Colombians | 99.8 /100 | #69 | Exceptional 11.5% |
| Immigrants | Chile | 99.8 /100 | #70 | Exceptional 11.5% |