White/Caucasian vs Immigrants from Spain Disability Age Under 5
COMPARE
White/Caucasian
Immigrants from Spain
Disability Age Under 5
Disability Age Under 5 Comparison
Whites/Caucasians
Immigrants from Spain
1.7%
DISABILITY AGE UNDER 5
0.0/ 100
METRIC RATING
310th/ 347
METRIC RANK
1.2%
DISABILITY AGE UNDER 5
86.5/ 100
METRIC RATING
133rd/ 347
METRIC RANK
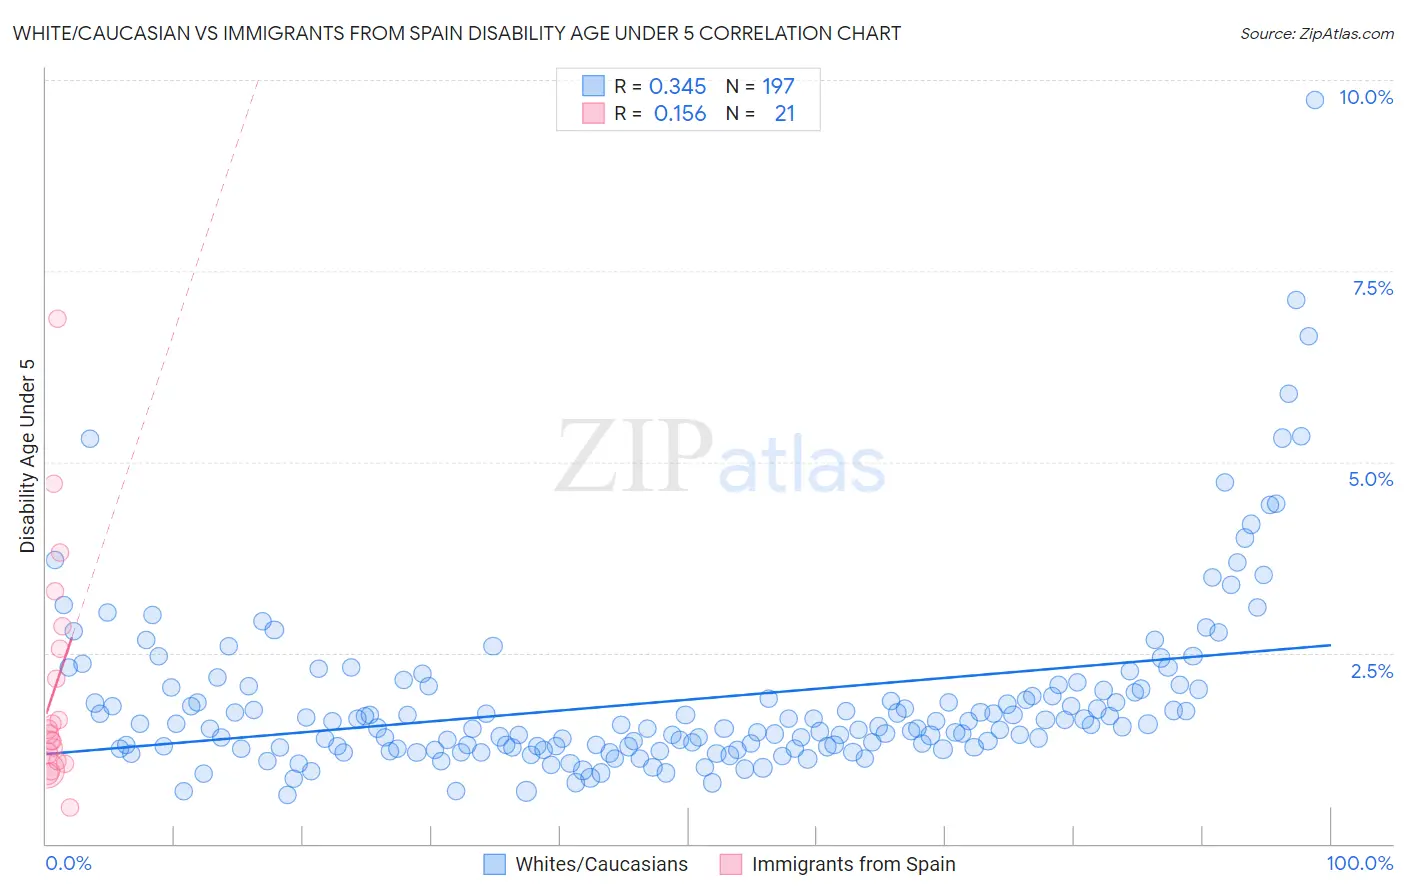
White/Caucasian vs Immigrants from Spain Disability Age Under 5 Correlation Chart
The statistical analysis conducted on geographies consisting of 262,459,062 people shows a mild positive correlation between the proportion of Whites/Caucasians and percentage of population with a disability under the age of 5 in the United States with a correlation coefficient (R) of 0.345 and weighted average of 1.7%. Similarly, the statistical analysis conducted on geographies consisting of 150,109,645 people shows a poor positive correlation between the proportion of Immigrants from Spain and percentage of population with a disability under the age of 5 in the United States with a correlation coefficient (R) of 0.156 and weighted average of 1.2%, a difference of 39.8%.
Disability Age Under 5 Correlation Summary
| Measurement | White/Caucasian | Immigrants from Spain |
| Minimum | 0.64% | 0.48% |
| Maximum | 9.7% | 6.9% |
| Range | 9.1% | 6.4% |
| Mean | 1.9% | 2.0% |
| Median | 1.5% | 1.4% |
| Interquartile 25% (IQ1) | 1.3% | 1.1% |
| Interquartile 75% (IQ3) | 2.0% | 2.7% |
| Interquartile Range (IQR) | 0.76% | 1.6% |
| Standard Deviation (Sample) | 1.2% | 1.5% |
| Standard Deviation (Population) | 1.2% | 1.5% |
Similar Demographics by Disability Age Under 5
Demographics Similar to Whites/Caucasians by Disability Age Under 5
In terms of disability age under 5, the demographic groups most similar to Whites/Caucasians are Cape Verdean (1.7%, a difference of 0.070%), English (1.7%, a difference of 0.59%), Puerto Rican (1.7%, a difference of 0.63%), Navajo (1.6%, a difference of 0.70%), and Celtic (1.7%, a difference of 0.79%).
| Demographics | Rating | Rank | Disability Age Under 5 |
| Swiss | 0.0 /100 | #303 | Tragic 1.6% |
| Seminole | 0.0 /100 | #304 | Tragic 1.6% |
| Blackfeet | 0.0 /100 | #305 | Tragic 1.6% |
| Creek | 0.0 /100 | #306 | Tragic 1.6% |
| Scottish | 0.0 /100 | #307 | Tragic 1.6% |
| Navajo | 0.0 /100 | #308 | Tragic 1.6% |
| Cape Verdeans | 0.0 /100 | #309 | Tragic 1.7% |
| Whites/Caucasians | 0.0 /100 | #310 | Tragic 1.7% |
| English | 0.0 /100 | #311 | Tragic 1.7% |
| Puerto Ricans | 0.0 /100 | #312 | Tragic 1.7% |
| Celtics | 0.0 /100 | #313 | Tragic 1.7% |
| Norwegians | 0.0 /100 | #314 | Tragic 1.7% |
| Dutch | 0.0 /100 | #315 | Tragic 1.7% |
| Immigrants | Cabo Verde | 0.0 /100 | #316 | Tragic 1.7% |
| French | 0.0 /100 | #317 | Tragic 1.7% |
Demographics Similar to Immigrants from Spain by Disability Age Under 5
In terms of disability age under 5, the demographic groups most similar to Immigrants from Spain are Immigrants from Eastern Europe (1.2%, a difference of 0.16%), Argentinean (1.2%, a difference of 0.16%), Immigrants from Serbia (1.2%, a difference of 0.23%), Korean (1.2%, a difference of 0.24%), and Immigrants (1.2%, a difference of 0.32%).
| Demographics | Rating | Rank | Disability Age Under 5 |
| Central Americans | 89.7 /100 | #126 | Excellent 1.2% |
| Immigrants | Romania | 88.4 /100 | #127 | Excellent 1.2% |
| Immigrants | France | 88.4 /100 | #128 | Excellent 1.2% |
| Immigrants | Immigrants | 88.0 /100 | #129 | Excellent 1.2% |
| Koreans | 87.7 /100 | #130 | Excellent 1.2% |
| Immigrants | Serbia | 87.6 /100 | #131 | Excellent 1.2% |
| Immigrants | Eastern Europe | 87.3 /100 | #132 | Excellent 1.2% |
| Immigrants | Spain | 86.5 /100 | #133 | Excellent 1.2% |
| Argentineans | 85.7 /100 | #134 | Excellent 1.2% |
| Fijians | 84.7 /100 | #135 | Excellent 1.2% |
| Moroccans | 83.6 /100 | #136 | Excellent 1.2% |
| Immigrants | Eastern Africa | 83.1 /100 | #137 | Excellent 1.2% |
| Immigrants | Czechoslovakia | 82.8 /100 | #138 | Excellent 1.2% |
| New Zealanders | 81.4 /100 | #139 | Excellent 1.2% |
| Somalis | 80.8 /100 | #140 | Excellent 1.2% |