Okinawan vs Immigrants from Spain Disability Age Under 5
COMPARE
Okinawan
Immigrants from Spain
Disability Age Under 5
Disability Age Under 5 Comparison
Okinawans
Immigrants from Spain
1.1%
DISABILITY AGE UNDER 5
97.6/ 100
METRIC RATING
86th/ 347
METRIC RANK
1.2%
DISABILITY AGE UNDER 5
86.5/ 100
METRIC RATING
133rd/ 347
METRIC RANK
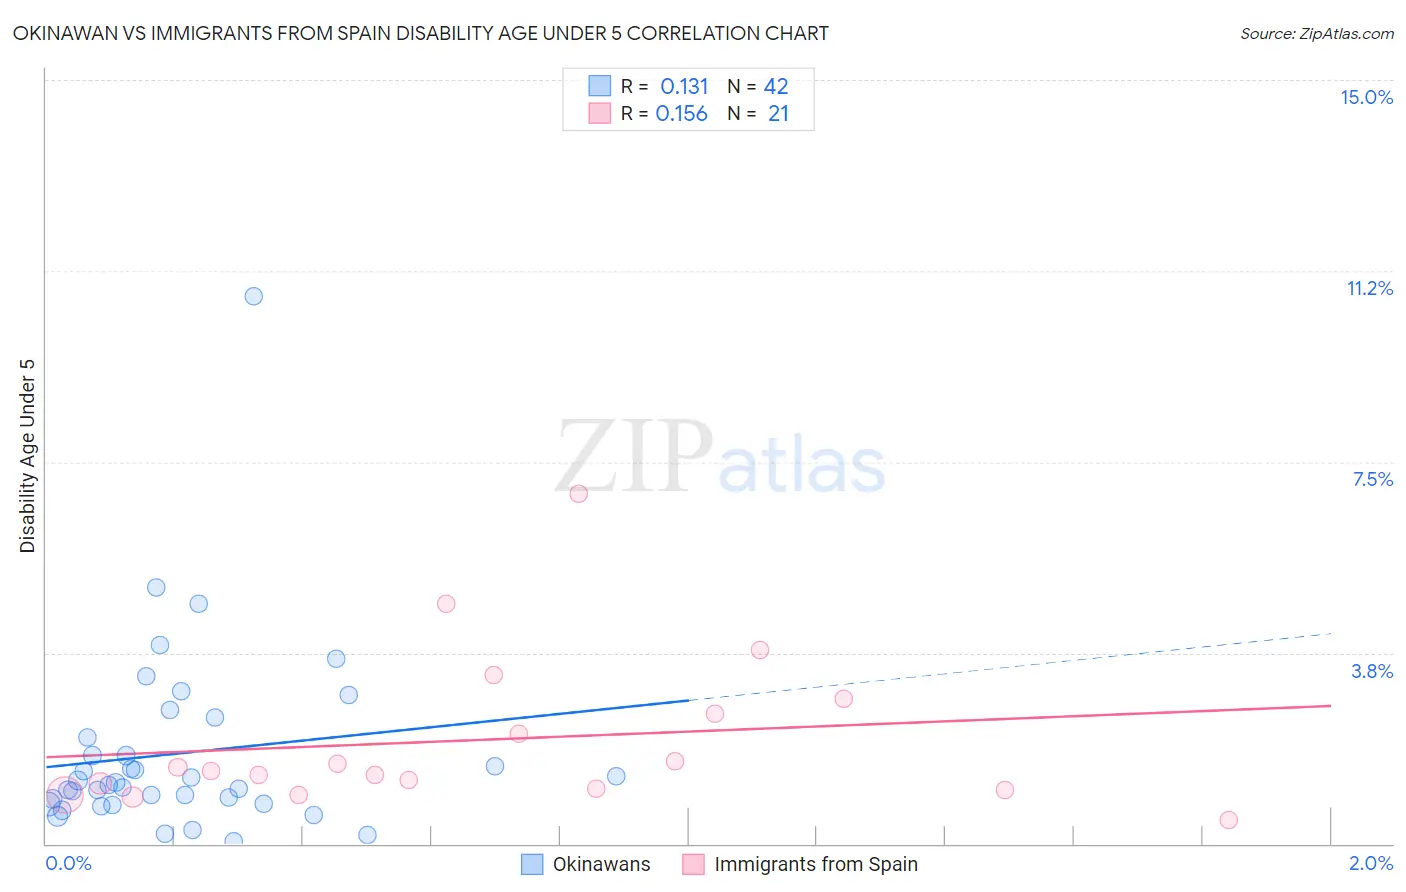
Okinawan vs Immigrants from Spain Disability Age Under 5 Correlation Chart
The statistical analysis conducted on geographies consisting of 59,482,262 people shows a poor positive correlation between the proportion of Okinawans and percentage of population with a disability under the age of 5 in the United States with a correlation coefficient (R) of 0.131 and weighted average of 1.1%. Similarly, the statistical analysis conducted on geographies consisting of 150,109,645 people shows a poor positive correlation between the proportion of Immigrants from Spain and percentage of population with a disability under the age of 5 in the United States with a correlation coefficient (R) of 0.156 and weighted average of 1.2%, a difference of 4.5%.
Disability Age Under 5 Correlation Summary
| Measurement | Okinawan | Immigrants from Spain |
| Minimum | 0.058% | 0.48% |
| Maximum | 10.8% | 6.9% |
| Range | 10.7% | 6.4% |
| Mean | 1.8% | 2.0% |
| Median | 1.2% | 1.4% |
| Interquartile 25% (IQ1) | 0.80% | 1.1% |
| Interquartile 75% (IQ3) | 2.1% | 2.7% |
| Interquartile Range (IQR) | 1.3% | 1.6% |
| Standard Deviation (Sample) | 1.8% | 1.5% |
| Standard Deviation (Population) | 1.8% | 1.5% |
Similar Demographics by Disability Age Under 5
Demographics Similar to Okinawans by Disability Age Under 5
In terms of disability age under 5, the demographic groups most similar to Okinawans are Ugandan (1.1%, a difference of 0.020%), Immigrants from Dominican Republic (1.1%, a difference of 0.040%), Sudanese (1.1%, a difference of 0.13%), Immigrants from Zaire (1.1%, a difference of 0.20%), and Ethiopian (1.1%, a difference of 0.32%).
| Demographics | Rating | Rank | Disability Age Under 5 |
| Hmong | 98.0 /100 | #79 | Exceptional 1.1% |
| Immigrants | Trinidad and Tobago | 98.0 /100 | #80 | Exceptional 1.1% |
| Turks | 98.0 /100 | #81 | Exceptional 1.1% |
| Immigrants | Jordan | 97.9 /100 | #82 | Exceptional 1.1% |
| Immigrants | Syria | 97.9 /100 | #83 | Exceptional 1.1% |
| Immigrants | Zaire | 97.8 /100 | #84 | Exceptional 1.1% |
| Sudanese | 97.7 /100 | #85 | Exceptional 1.1% |
| Okinawans | 97.6 /100 | #86 | Exceptional 1.1% |
| Ugandans | 97.5 /100 | #87 | Exceptional 1.1% |
| Immigrants | Dominican Republic | 97.5 /100 | #88 | Exceptional 1.1% |
| Ethiopians | 97.2 /100 | #89 | Exceptional 1.1% |
| Chinese | 97.2 /100 | #90 | Exceptional 1.1% |
| Albanians | 97.2 /100 | #91 | Exceptional 1.1% |
| Immigrants | Cuba | 97.0 /100 | #92 | Exceptional 1.1% |
| Spanish Americans | 96.9 /100 | #93 | Exceptional 1.1% |
Demographics Similar to Immigrants from Spain by Disability Age Under 5
In terms of disability age under 5, the demographic groups most similar to Immigrants from Spain are Immigrants from Eastern Europe (1.2%, a difference of 0.16%), Argentinean (1.2%, a difference of 0.16%), Immigrants from Serbia (1.2%, a difference of 0.23%), Korean (1.2%, a difference of 0.24%), and Immigrants (1.2%, a difference of 0.32%).
| Demographics | Rating | Rank | Disability Age Under 5 |
| Central Americans | 89.7 /100 | #126 | Excellent 1.2% |
| Immigrants | Romania | 88.4 /100 | #127 | Excellent 1.2% |
| Immigrants | France | 88.4 /100 | #128 | Excellent 1.2% |
| Immigrants | Immigrants | 88.0 /100 | #129 | Excellent 1.2% |
| Koreans | 87.7 /100 | #130 | Excellent 1.2% |
| Immigrants | Serbia | 87.6 /100 | #131 | Excellent 1.2% |
| Immigrants | Eastern Europe | 87.3 /100 | #132 | Excellent 1.2% |
| Immigrants | Spain | 86.5 /100 | #133 | Excellent 1.2% |
| Argentineans | 85.7 /100 | #134 | Excellent 1.2% |
| Fijians | 84.7 /100 | #135 | Excellent 1.2% |
| Moroccans | 83.6 /100 | #136 | Excellent 1.2% |
| Immigrants | Eastern Africa | 83.1 /100 | #137 | Excellent 1.2% |
| Immigrants | Czechoslovakia | 82.8 /100 | #138 | Excellent 1.2% |
| New Zealanders | 81.4 /100 | #139 | Excellent 1.2% |
| Somalis | 80.8 /100 | #140 | Excellent 1.2% |