White/Caucasian vs Immigrants from Spain Bachelor's Degree
COMPARE
White/Caucasian
Immigrants from Spain
Bachelor's Degree
Bachelor's Degree Comparison
Whites/Caucasians
Immigrants from Spain
35.3%
BACHELOR'S DEGREE
5.9/ 100
METRIC RATING
229th/ 347
METRIC RANK
44.3%
BACHELOR'S DEGREE
99.9/ 100
METRIC RATING
52nd/ 347
METRIC RANK
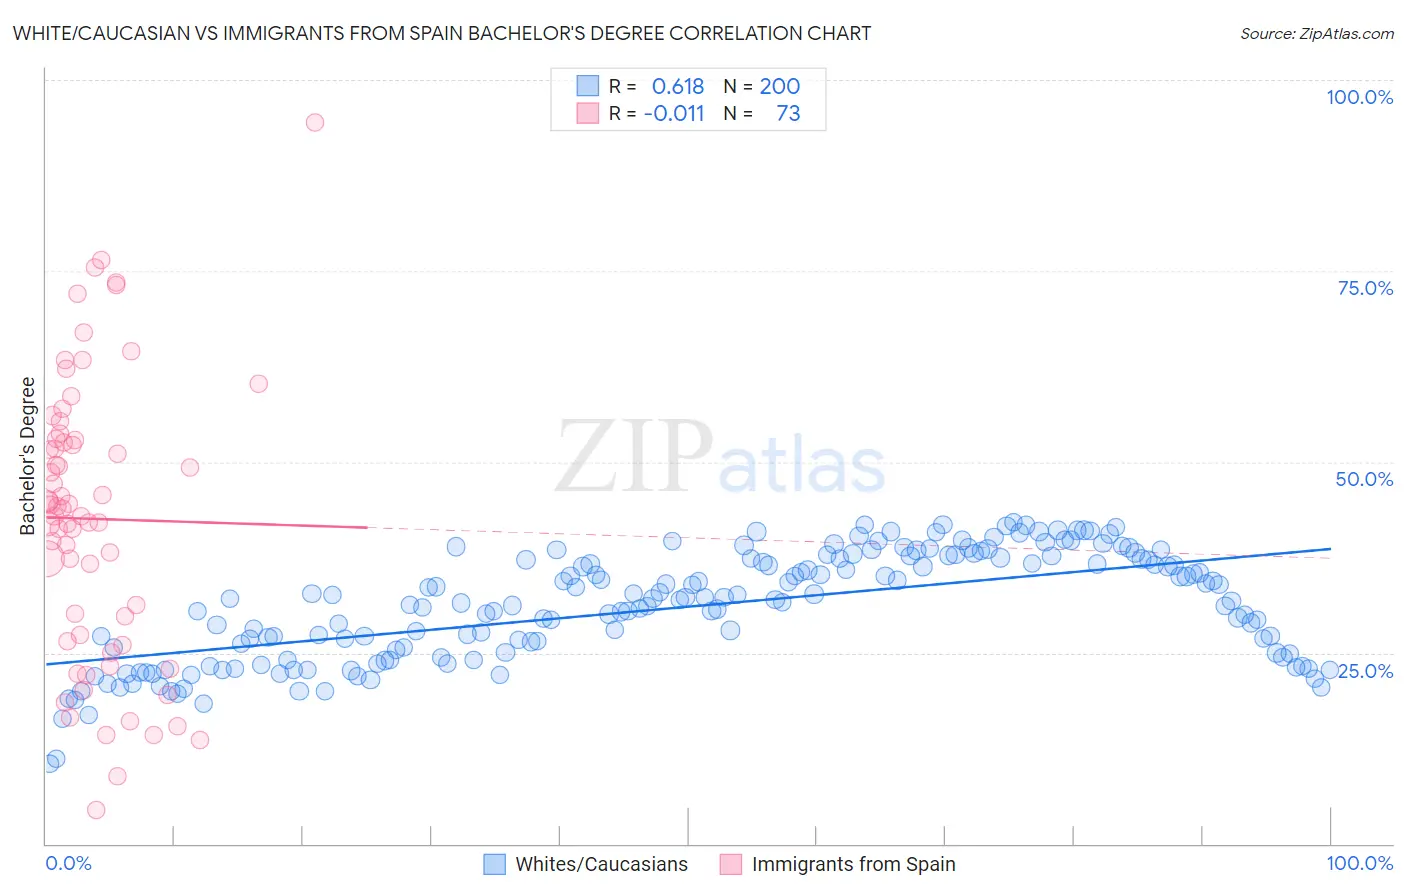
White/Caucasian vs Immigrants from Spain Bachelor's Degree Correlation Chart
The statistical analysis conducted on geographies consisting of 584,716,229 people shows a significant positive correlation between the proportion of Whites/Caucasians and percentage of population with at least bachelor's degree education in the United States with a correlation coefficient (R) of 0.618 and weighted average of 35.3%. Similarly, the statistical analysis conducted on geographies consisting of 239,678,363 people shows no correlation between the proportion of Immigrants from Spain and percentage of population with at least bachelor's degree education in the United States with a correlation coefficient (R) of -0.011 and weighted average of 44.3%, a difference of 25.6%.
Bachelor's Degree Correlation Summary
| Measurement | White/Caucasian | Immigrants from Spain |
| Minimum | 10.4% | 4.4% |
| Maximum | 42.1% | 94.4% |
| Range | 31.7% | 90.0% |
| Mean | 31.0% | 42.5% |
| Median | 31.9% | 43.9% |
| Interquartile 25% (IQ1) | 24.9% | 26.9% |
| Interquartile 75% (IQ3) | 37.3% | 52.9% |
| Interquartile Range (IQR) | 12.4% | 26.1% |
| Standard Deviation (Sample) | 7.1% | 18.3% |
| Standard Deviation (Population) | 7.1% | 18.2% |
Similar Demographics by Bachelor's Degree
Demographics Similar to Whites/Caucasians by Bachelor's Degree
In terms of bachelor's degree, the demographic groups most similar to Whites/Caucasians are Immigrants from Trinidad and Tobago (35.3%, a difference of 0.080%), Ecuadorian (35.4%, a difference of 0.31%), Portuguese (35.5%, a difference of 0.57%), Immigrants from Burma/Myanmar (35.5%, a difference of 0.61%), and Immigrants from Barbados (35.5%, a difference of 0.68%).
| Demographics | Rating | Rank | Bachelor's Degree |
| Trinidadians and Tobagonians | 8.8 /100 | #222 | Tragic 35.7% |
| French Canadians | 8.3 /100 | #223 | Tragic 35.6% |
| Immigrants | Barbados | 7.5 /100 | #224 | Tragic 35.5% |
| Immigrants | Burma/Myanmar | 7.3 /100 | #225 | Tragic 35.5% |
| Portuguese | 7.2 /100 | #226 | Tragic 35.5% |
| Ecuadorians | 6.6 /100 | #227 | Tragic 35.4% |
| Immigrants | Trinidad and Tobago | 6.0 /100 | #228 | Tragic 35.3% |
| Whites/Caucasians | 5.9 /100 | #229 | Tragic 35.3% |
| Immigrants | Grenada | 4.3 /100 | #230 | Tragic 35.0% |
| Immigrants | St. Vincent and the Grenadines | 4.3 /100 | #231 | Tragic 35.0% |
| Hmong | 3.4 /100 | #232 | Tragic 34.8% |
| Immigrants | Ecuador | 3.3 /100 | #233 | Tragic 34.7% |
| Guamanians/Chamorros | 3.0 /100 | #234 | Tragic 34.6% |
| Immigrants | West Indies | 2.9 /100 | #235 | Tragic 34.6% |
| Liberians | 2.8 /100 | #236 | Tragic 34.6% |
Demographics Similar to Immigrants from Spain by Bachelor's Degree
In terms of bachelor's degree, the demographic groups most similar to Immigrants from Spain are Immigrants from Asia (44.3%, a difference of 0.060%), Asian (44.4%, a difference of 0.18%), Immigrants from Austria (44.2%, a difference of 0.24%), Immigrants from Bolivia (44.2%, a difference of 0.25%), and Immigrants from Greece (44.5%, a difference of 0.32%).
| Demographics | Rating | Rank | Bachelor's Degree |
| Immigrants | Kuwait | 99.9 /100 | #45 | Exceptional 44.6% |
| Immigrants | Bulgaria | 99.9 /100 | #46 | Exceptional 44.6% |
| Bolivians | 99.9 /100 | #47 | Exceptional 44.6% |
| Estonians | 99.9 /100 | #48 | Exceptional 44.6% |
| Immigrants | Norway | 99.9 /100 | #49 | Exceptional 44.5% |
| Immigrants | Greece | 99.9 /100 | #50 | Exceptional 44.5% |
| Asians | 99.9 /100 | #51 | Exceptional 44.4% |
| Immigrants | Spain | 99.9 /100 | #52 | Exceptional 44.3% |
| Immigrants | Asia | 99.9 /100 | #53 | Exceptional 44.3% |
| Immigrants | Austria | 99.9 /100 | #54 | Exceptional 44.2% |
| Immigrants | Bolivia | 99.9 /100 | #55 | Exceptional 44.2% |
| Immigrants | Serbia | 99.9 /100 | #56 | Exceptional 44.1% |
| Paraguayans | 99.9 /100 | #57 | Exceptional 44.0% |
| Immigrants | Czechoslovakia | 99.9 /100 | #58 | Exceptional 44.0% |
| Australians | 99.9 /100 | #59 | Exceptional 44.0% |