Immigrants from Hong Kong vs Immigrants from Spain Disability Age Under 5
COMPARE
Immigrants from Hong Kong
Immigrants from Spain
Disability Age Under 5
Disability Age Under 5 Comparison
Immigrants from Hong Kong
Immigrants from Spain
0.95%
DISABILITY AGE UNDER 5
100.0/ 100
METRIC RATING
15th/ 347
METRIC RANK
1.2%
DISABILITY AGE UNDER 5
86.5/ 100
METRIC RATING
133rd/ 347
METRIC RANK
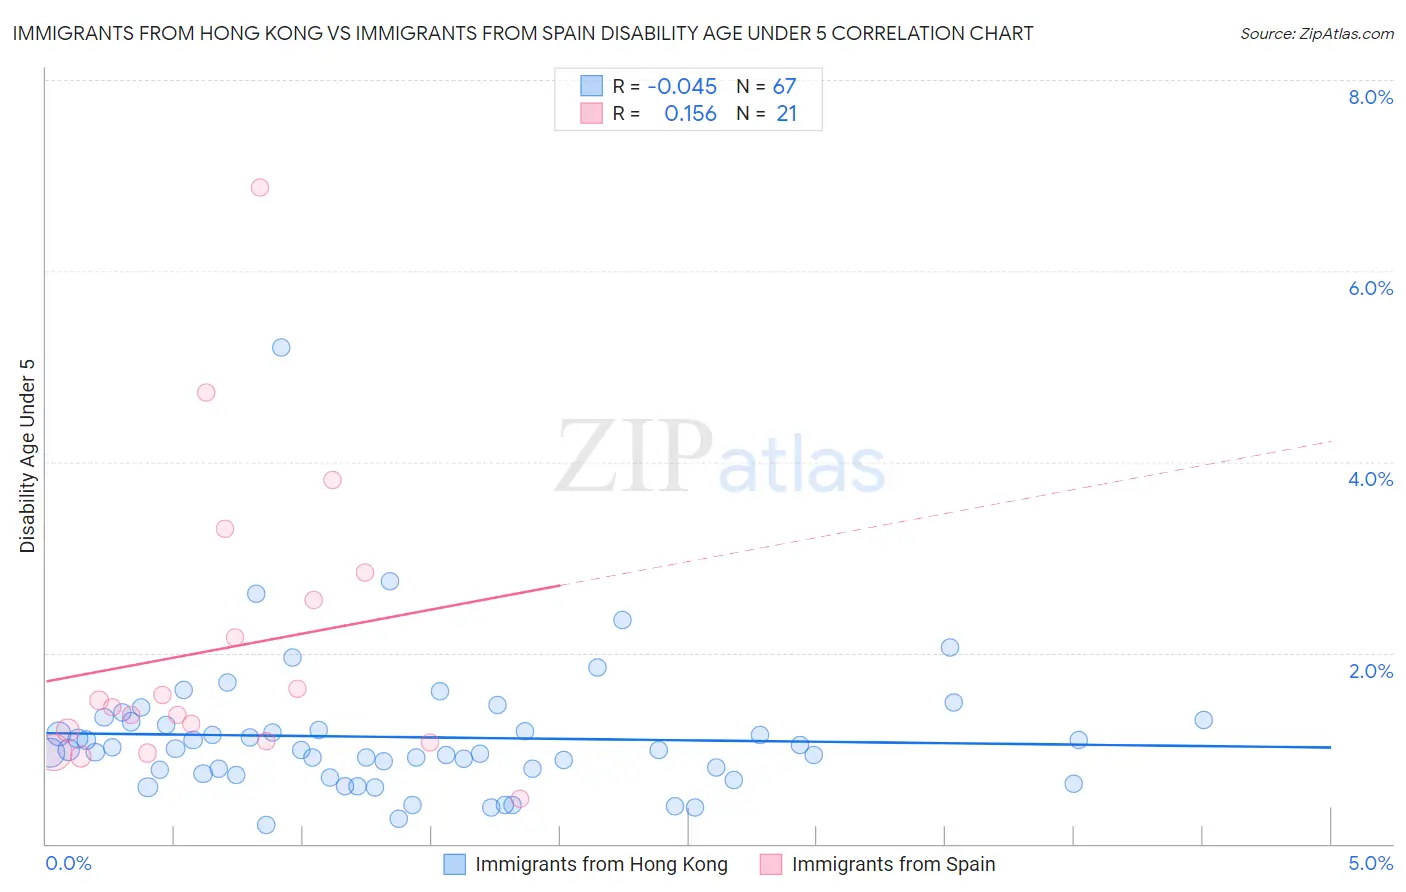
Immigrants from Hong Kong vs Immigrants from Spain Disability Age Under 5 Correlation Chart
The statistical analysis conducted on geographies consisting of 156,756,325 people shows no correlation between the proportion of Immigrants from Hong Kong and percentage of population with a disability under the age of 5 in the United States with a correlation coefficient (R) of -0.045 and weighted average of 0.95%. Similarly, the statistical analysis conducted on geographies consisting of 150,109,645 people shows a poor positive correlation between the proportion of Immigrants from Spain and percentage of population with a disability under the age of 5 in the United States with a correlation coefficient (R) of 0.156 and weighted average of 1.2%, a difference of 25.5%.
Disability Age Under 5 Correlation Summary
| Measurement | Immigrants from Hong Kong | Immigrants from Spain |
| Minimum | 0.19% | 0.48% |
| Maximum | 5.2% | 6.9% |
| Range | 5.0% | 6.4% |
| Mean | 1.1% | 2.0% |
| Median | 0.98% | 1.4% |
| Interquartile 25% (IQ1) | 0.73% | 1.1% |
| Interquartile 75% (IQ3) | 1.3% | 2.7% |
| Interquartile Range (IQR) | 0.55% | 1.6% |
| Standard Deviation (Sample) | 0.72% | 1.5% |
| Standard Deviation (Population) | 0.72% | 1.5% |
Similar Demographics by Disability Age Under 5
Demographics Similar to Immigrants from Hong Kong by Disability Age Under 5
In terms of disability age under 5, the demographic groups most similar to Immigrants from Hong Kong are Yuman (0.95%, a difference of 0.030%), Soviet Union (0.95%, a difference of 0.11%), Immigrants from Grenada (0.94%, a difference of 0.28%), Afghan (0.94%, a difference of 0.30%), and Marshallese (0.94%, a difference of 1.1%).
| Demographics | Rating | Rank | Disability Age Under 5 |
| Immigrants | Yemen | 100.0 /100 | #8 | Exceptional 0.91% |
| Immigrants | Fiji | 100.0 /100 | #9 | Exceptional 0.92% |
| Marshallese | 100.0 /100 | #10 | Exceptional 0.94% |
| Afghans | 100.0 /100 | #11 | Exceptional 0.94% |
| Immigrants | Grenada | 100.0 /100 | #12 | Exceptional 0.94% |
| Soviet Union | 100.0 /100 | #13 | Exceptional 0.95% |
| Yuman | 100.0 /100 | #14 | Exceptional 0.95% |
| Immigrants | Hong Kong | 100.0 /100 | #15 | Exceptional 0.95% |
| Immigrants | Israel | 100.0 /100 | #16 | Exceptional 0.96% |
| Immigrants | China | 100.0 /100 | #17 | Exceptional 0.96% |
| Immigrants | Barbados | 100.0 /100 | #18 | Exceptional 0.97% |
| Puget Sound Salish | 100.0 /100 | #19 | Exceptional 0.97% |
| Nepalese | 100.0 /100 | #20 | Exceptional 0.97% |
| British West Indians | 100.0 /100 | #21 | Exceptional 0.99% |
| Immigrants | Iran | 100.0 /100 | #22 | Exceptional 1.00% |
Demographics Similar to Immigrants from Spain by Disability Age Under 5
In terms of disability age under 5, the demographic groups most similar to Immigrants from Spain are Immigrants from Eastern Europe (1.2%, a difference of 0.16%), Argentinean (1.2%, a difference of 0.16%), Immigrants from Serbia (1.2%, a difference of 0.23%), Korean (1.2%, a difference of 0.24%), and Immigrants (1.2%, a difference of 0.32%).
| Demographics | Rating | Rank | Disability Age Under 5 |
| Central Americans | 89.7 /100 | #126 | Excellent 1.2% |
| Immigrants | Romania | 88.4 /100 | #127 | Excellent 1.2% |
| Immigrants | France | 88.4 /100 | #128 | Excellent 1.2% |
| Immigrants | Immigrants | 88.0 /100 | #129 | Excellent 1.2% |
| Koreans | 87.7 /100 | #130 | Excellent 1.2% |
| Immigrants | Serbia | 87.6 /100 | #131 | Excellent 1.2% |
| Immigrants | Eastern Europe | 87.3 /100 | #132 | Excellent 1.2% |
| Immigrants | Spain | 86.5 /100 | #133 | Excellent 1.2% |
| Argentineans | 85.7 /100 | #134 | Excellent 1.2% |
| Fijians | 84.7 /100 | #135 | Excellent 1.2% |
| Moroccans | 83.6 /100 | #136 | Excellent 1.2% |
| Immigrants | Eastern Africa | 83.1 /100 | #137 | Excellent 1.2% |
| Immigrants | Czechoslovakia | 82.8 /100 | #138 | Excellent 1.2% |
| New Zealanders | 81.4 /100 | #139 | Excellent 1.2% |
| Somalis | 80.8 /100 | #140 | Excellent 1.2% |