White/Caucasian vs Arapaho Disability Age Under 5
COMPARE
White/Caucasian
Arapaho
Disability Age Under 5
Disability Age Under 5 Comparison
Whites/Caucasians
Arapaho
1.7%
DISABILITY AGE UNDER 5
0.0/ 100
METRIC RATING
310th/ 347
METRIC RANK
1.3%
DISABILITY AGE UNDER 5
24.1/ 100
METRIC RATING
202nd/ 347
METRIC RANK
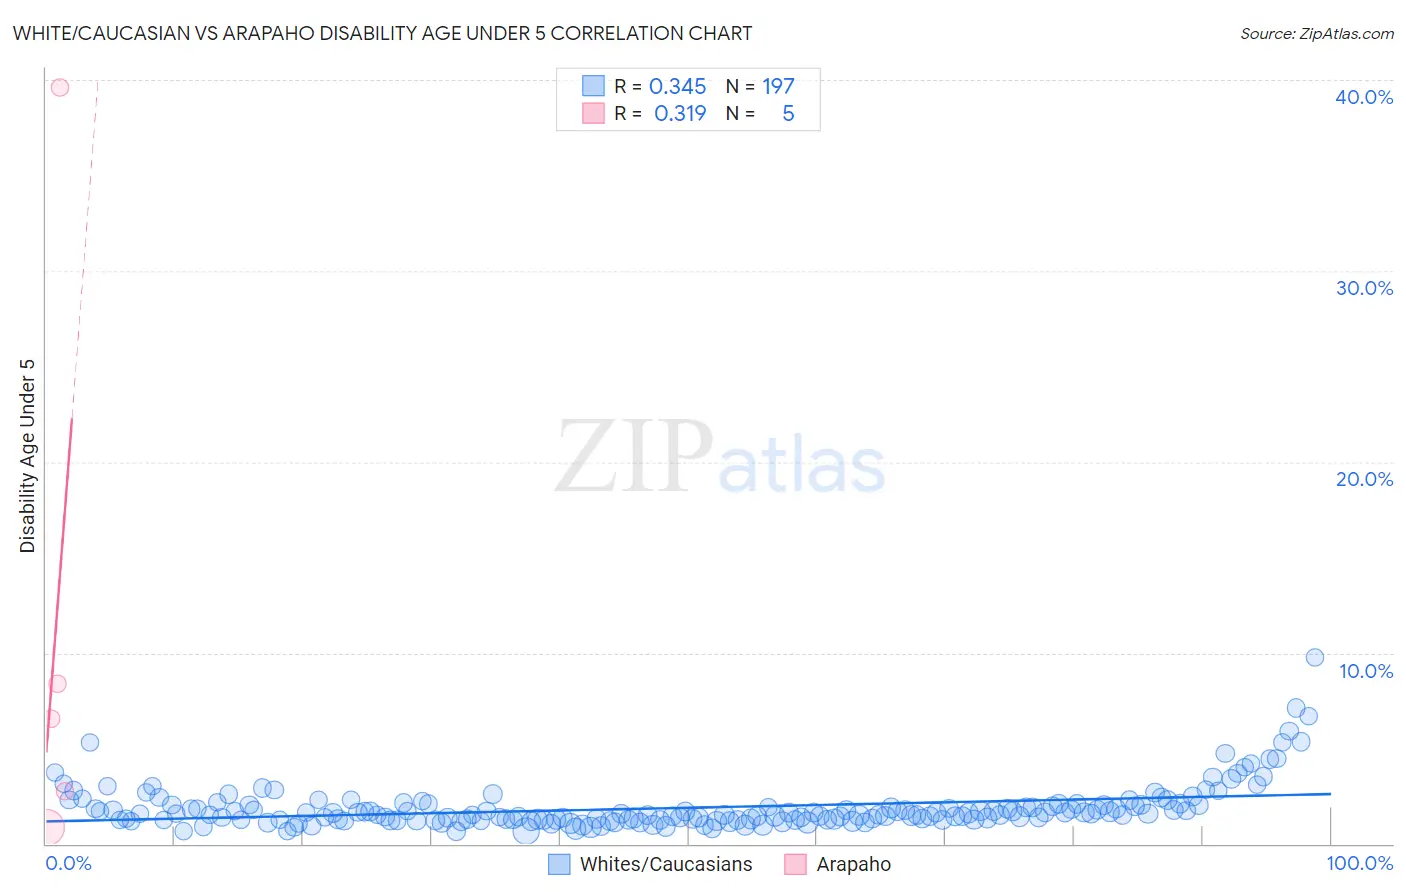
White/Caucasian vs Arapaho Disability Age Under 5 Correlation Chart
The statistical analysis conducted on geographies consisting of 262,459,062 people shows a mild positive correlation between the proportion of Whites/Caucasians and percentage of population with a disability under the age of 5 in the United States with a correlation coefficient (R) of 0.345 and weighted average of 1.7%. Similarly, the statistical analysis conducted on geographies consisting of 24,959,327 people shows a mild positive correlation between the proportion of Arapaho and percentage of population with a disability under the age of 5 in the United States with a correlation coefficient (R) of 0.319 and weighted average of 1.3%, a difference of 30.5%.
Disability Age Under 5 Correlation Summary
| Measurement | White/Caucasian | Arapaho |
| Minimum | 0.64% | 0.87% |
| Maximum | 9.7% | 39.6% |
| Range | 9.1% | 38.7% |
| Mean | 1.9% | 11.6% |
| Median | 1.5% | 6.5% |
| Interquartile 25% (IQ1) | 1.3% | 1.8% |
| Interquartile 75% (IQ3) | 2.0% | 24.0% |
| Interquartile Range (IQR) | 0.76% | 22.2% |
| Standard Deviation (Sample) | 1.2% | 15.9% |
| Standard Deviation (Population) | 1.2% | 14.2% |
Similar Demographics by Disability Age Under 5
Demographics Similar to Whites/Caucasians by Disability Age Under 5
In terms of disability age under 5, the demographic groups most similar to Whites/Caucasians are Cape Verdean (1.7%, a difference of 0.070%), English (1.7%, a difference of 0.59%), Puerto Rican (1.7%, a difference of 0.63%), Navajo (1.6%, a difference of 0.70%), and Celtic (1.7%, a difference of 0.79%).
| Demographics | Rating | Rank | Disability Age Under 5 |
| Swiss | 0.0 /100 | #303 | Tragic 1.6% |
| Seminole | 0.0 /100 | #304 | Tragic 1.6% |
| Blackfeet | 0.0 /100 | #305 | Tragic 1.6% |
| Creek | 0.0 /100 | #306 | Tragic 1.6% |
| Scottish | 0.0 /100 | #307 | Tragic 1.6% |
| Navajo | 0.0 /100 | #308 | Tragic 1.6% |
| Cape Verdeans | 0.0 /100 | #309 | Tragic 1.7% |
| Whites/Caucasians | 0.0 /100 | #310 | Tragic 1.7% |
| English | 0.0 /100 | #311 | Tragic 1.7% |
| Puerto Ricans | 0.0 /100 | #312 | Tragic 1.7% |
| Celtics | 0.0 /100 | #313 | Tragic 1.7% |
| Norwegians | 0.0 /100 | #314 | Tragic 1.7% |
| Dutch | 0.0 /100 | #315 | Tragic 1.7% |
| Immigrants | Cabo Verde | 0.0 /100 | #316 | Tragic 1.7% |
| French | 0.0 /100 | #317 | Tragic 1.7% |
Demographics Similar to Arapaho by Disability Age Under 5
In terms of disability age under 5, the demographic groups most similar to Arapaho are Liberian (1.3%, a difference of 0.020%), Immigrants from Europe (1.3%, a difference of 0.060%), Immigrants from Italy (1.3%, a difference of 0.15%), Romanian (1.3%, a difference of 0.20%), and Immigrants from Poland (1.3%, a difference of 0.22%).
| Demographics | Rating | Rank | Disability Age Under 5 |
| U.S. Virgin Islanders | 34.4 /100 | #195 | Fair 1.3% |
| Immigrants | Belgium | 31.4 /100 | #196 | Fair 1.3% |
| Immigrants | Somalia | 31.3 /100 | #197 | Fair 1.3% |
| Immigrants | Norway | 31.1 /100 | #198 | Fair 1.3% |
| Jamaicans | 30.7 /100 | #199 | Fair 1.3% |
| Immigrants | Lithuania | 27.2 /100 | #200 | Fair 1.3% |
| Immigrants | Italy | 25.4 /100 | #201 | Fair 1.3% |
| Arapaho | 24.1 /100 | #202 | Fair 1.3% |
| Liberians | 24.0 /100 | #203 | Fair 1.3% |
| Immigrants | Europe | 23.6 /100 | #204 | Fair 1.3% |
| Romanians | 22.5 /100 | #205 | Fair 1.3% |
| Immigrants | Poland | 22.4 /100 | #206 | Fair 1.3% |
| Nigerians | 21.2 /100 | #207 | Fair 1.3% |
| Mexicans | 20.8 /100 | #208 | Fair 1.3% |
| Bulgarians | 19.5 /100 | #209 | Poor 1.3% |