White/Caucasian vs Bolivian Median Household Income
COMPARE
White/Caucasian
Bolivian
Median Household Income
Median Household Income Comparison
Whites/Caucasians
Bolivians
$82,029
MEDIAN HOUSEHOLD INCOME
12.2/ 100
METRIC RATING
218th/ 347
METRIC RANK
$102,195
MEDIAN HOUSEHOLD INCOME
100.0/ 100
METRIC RATING
20th/ 347
METRIC RANK
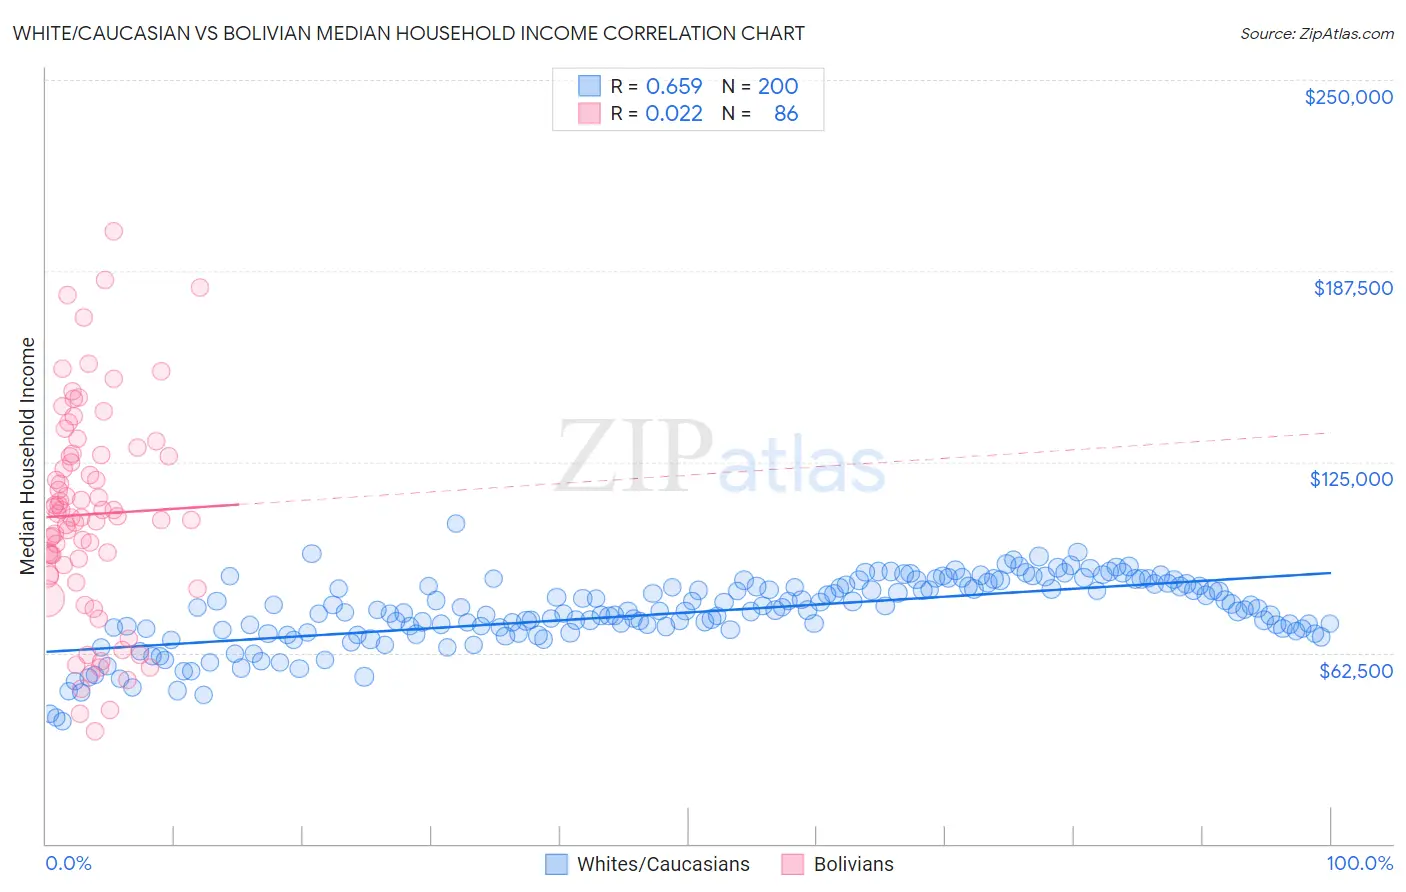
White/Caucasian vs Bolivian Median Household Income Correlation Chart
The statistical analysis conducted on geographies consisting of 583,274,044 people shows a significant positive correlation between the proportion of Whites/Caucasians and median household income in the United States with a correlation coefficient (R) of 0.659 and weighted average of $82,029. Similarly, the statistical analysis conducted on geographies consisting of 184,606,856 people shows no correlation between the proportion of Bolivians and median household income in the United States with a correlation coefficient (R) of 0.022 and weighted average of $102,195, a difference of 24.6%.
Median Household Income Correlation Summary
| Measurement | White/Caucasian | Bolivian |
| Minimum | $40,196 | $36,777 |
| Maximum | $104,886 | $200,625 |
| Range | $64,690 | $163,848 |
| Mean | $75,721 | $107,810 |
| Median | $76,251 | $106,861 |
| Interquartile 25% (IQ1) | $70,055 | $87,882 |
| Interquartile 75% (IQ3) | $84,369 | $127,141 |
| Interquartile Range (IQR) | $14,314 | $39,259 |
| Standard Deviation (Sample) | $11,326 | $34,248 |
| Standard Deviation (Population) | $11,297 | $34,049 |
Similar Demographics by Median Household Income
Demographics Similar to Whites/Caucasians by Median Household Income
In terms of median household income, the demographic groups most similar to Whites/Caucasians are Ecuadorian ($82,070, a difference of 0.050%), Yugoslavian ($82,186, a difference of 0.19%), Vietnamese ($82,248, a difference of 0.27%), Panamanian ($82,272, a difference of 0.30%), and Nigerian ($81,725, a difference of 0.37%).
| Demographics | Rating | Rank | Median Household Income |
| Salvadorans | 15.4 /100 | #211 | Poor $82,449 |
| Venezuelans | 15.3 /100 | #212 | Poor $82,432 |
| Nepalese | 15.1 /100 | #213 | Poor $82,410 |
| Panamanians | 14.0 /100 | #214 | Poor $82,272 |
| Vietnamese | 13.8 /100 | #215 | Poor $82,248 |
| Yugoslavians | 13.3 /100 | #216 | Poor $82,186 |
| Ecuadorians | 12.5 /100 | #217 | Poor $82,070 |
| Whites/Caucasians | 12.2 /100 | #218 | Poor $82,029 |
| Nigerians | 10.3 /100 | #219 | Poor $81,725 |
| Immigrants | Venezuela | 9.0 /100 | #220 | Tragic $81,506 |
| Immigrants | Ghana | 9.0 /100 | #221 | Tragic $81,489 |
| Immigrants | Nigeria | 7.7 /100 | #222 | Tragic $81,236 |
| Immigrants | El Salvador | 7.6 /100 | #223 | Tragic $81,213 |
| Malaysians | 7.0 /100 | #224 | Tragic $81,064 |
| Scotch-Irish | 6.6 /100 | #225 | Tragic $80,972 |
Demographics Similar to Bolivians by Median Household Income
In terms of median household income, the demographic groups most similar to Bolivians are Immigrants from Australia ($102,562, a difference of 0.36%), Eastern European ($101,781, a difference of 0.41%), Asian ($101,681, a difference of 0.50%), Cypriot ($102,843, a difference of 0.63%), and Immigrants from Korea ($102,962, a difference of 0.75%).
| Demographics | Rating | Rank | Median Household Income |
| Immigrants | Eastern Asia | 100.0 /100 | #13 | Exceptional $104,796 |
| Immigrants | Ireland | 100.0 /100 | #14 | Exceptional $104,692 |
| Immigrants | Israel | 100.0 /100 | #15 | Exceptional $104,090 |
| Burmese | 100.0 /100 | #16 | Exceptional $103,145 |
| Immigrants | Korea | 100.0 /100 | #17 | Exceptional $102,962 |
| Cypriots | 100.0 /100 | #18 | Exceptional $102,843 |
| Immigrants | Australia | 100.0 /100 | #19 | Exceptional $102,562 |
| Bolivians | 100.0 /100 | #20 | Exceptional $102,195 |
| Eastern Europeans | 100.0 /100 | #21 | Exceptional $101,781 |
| Asians | 100.0 /100 | #22 | Exceptional $101,681 |
| Immigrants | Bolivia | 100.0 /100 | #23 | Exceptional $101,394 |
| Immigrants | Japan | 100.0 /100 | #24 | Exceptional $100,711 |
| Immigrants | Sweden | 100.0 /100 | #25 | Exceptional $100,699 |
| Immigrants | Belgium | 100.0 /100 | #26 | Exceptional $100,306 |
| Bhutanese | 100.0 /100 | #27 | Exceptional $100,151 |