West Indian vs Immigrants from Croatia Self-Care Disability
COMPARE
West Indian
Immigrants from Croatia
Self-Care Disability
Self-Care Disability Comparison
West Indians
Immigrants from Croatia
2.8%
SELF-CARE DISABILITY
0.0/ 100
METRIC RATING
297th/ 347
METRIC RANK
2.4%
SELF-CARE DISABILITY
86.6/ 100
METRIC RATING
138th/ 347
METRIC RANK
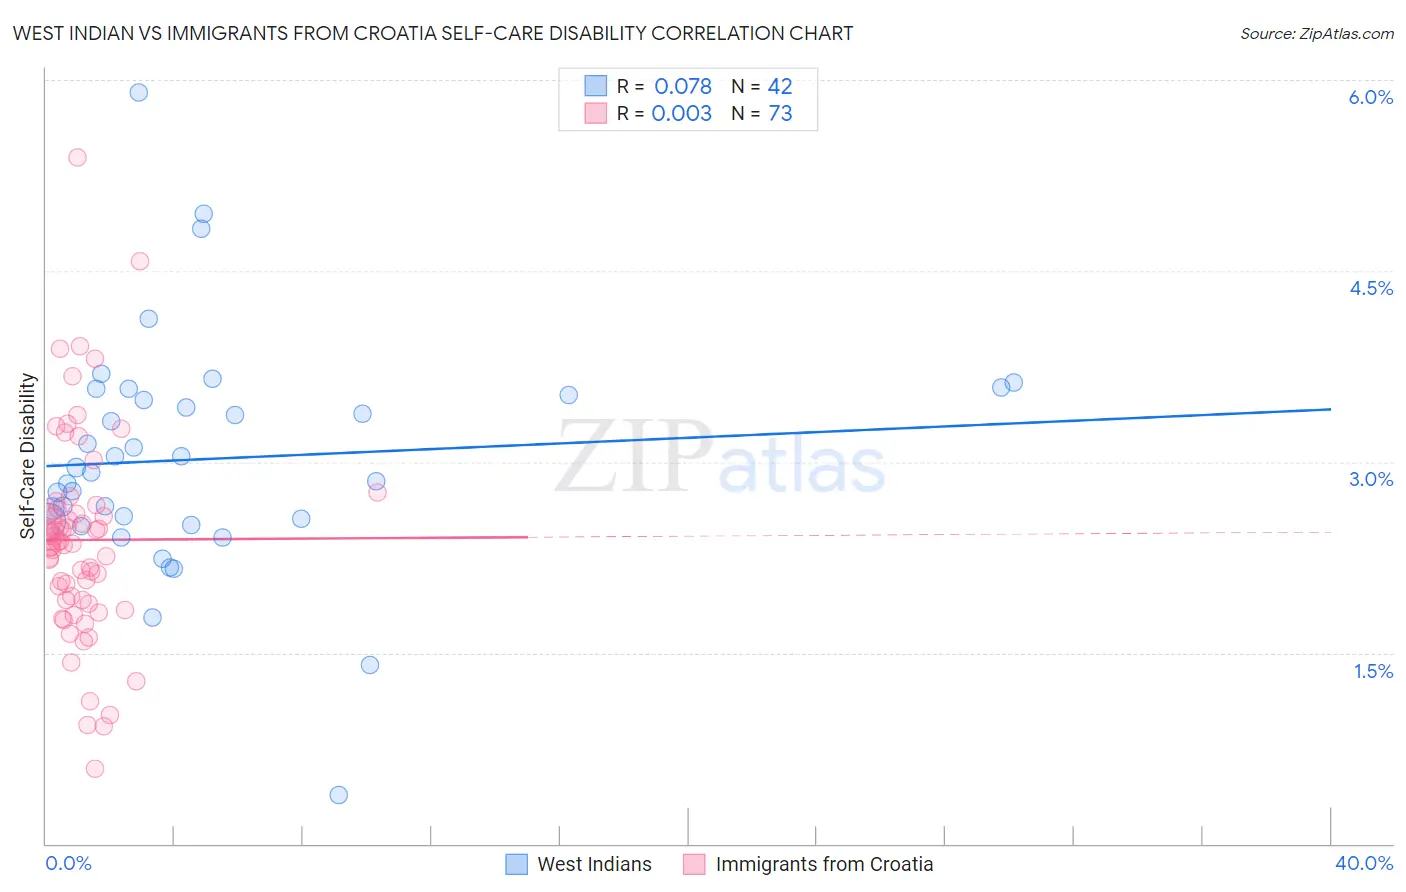
West Indian vs Immigrants from Croatia Self-Care Disability Correlation Chart
The statistical analysis conducted on geographies consisting of 253,805,677 people shows a slight positive correlation between the proportion of West Indians and percentage of population with self-care disability in the United States with a correlation coefficient (R) of 0.078 and weighted average of 2.8%. Similarly, the statistical analysis conducted on geographies consisting of 132,547,892 people shows no correlation between the proportion of Immigrants from Croatia and percentage of population with self-care disability in the United States with a correlation coefficient (R) of 0.003 and weighted average of 2.4%, a difference of 14.4%.
Self-Care Disability Correlation Summary
| Measurement | West Indian | Immigrants from Croatia |
| Minimum | 0.38% | 0.59% |
| Maximum | 5.9% | 5.4% |
| Range | 5.5% | 4.8% |
| Mean | 3.0% | 2.4% |
| Median | 2.9% | 2.4% |
| Interquartile 25% (IQ1) | 2.5% | 1.9% |
| Interquartile 75% (IQ3) | 3.5% | 2.6% |
| Interquartile Range (IQR) | 1.00% | 0.70% |
| Standard Deviation (Sample) | 0.93% | 0.81% |
| Standard Deviation (Population) | 0.92% | 0.80% |
Similar Demographics by Self-Care Disability
Demographics Similar to West Indians by Self-Care Disability
In terms of self-care disability, the demographic groups most similar to West Indians are Immigrants from Portugal (2.8%, a difference of 0.090%), American (2.8%, a difference of 0.12%), Immigrants from Guyana (2.8%, a difference of 0.21%), Barbadian (2.7%, a difference of 0.51%), and Central American Indian (2.7%, a difference of 0.66%).
| Demographics | Rating | Rank | Self-Care Disability |
| Cubans | 0.0 /100 | #290 | Tragic 2.7% |
| Guyanese | 0.0 /100 | #291 | Tragic 2.7% |
| Central American Indians | 0.0 /100 | #292 | Tragic 2.7% |
| Belizeans | 0.0 /100 | #293 | Tragic 2.7% |
| Blackfeet | 0.0 /100 | #294 | Tragic 2.7% |
| Barbadians | 0.0 /100 | #295 | Tragic 2.7% |
| Immigrants | Portugal | 0.0 /100 | #296 | Tragic 2.8% |
| West Indians | 0.0 /100 | #297 | Tragic 2.8% |
| Americans | 0.0 /100 | #298 | Tragic 2.8% |
| Immigrants | Guyana | 0.0 /100 | #299 | Tragic 2.8% |
| Immigrants | Fiji | 0.0 /100 | #300 | Tragic 2.8% |
| Pima | 0.0 /100 | #301 | Tragic 2.8% |
| Immigrants | St. Vincent and the Grenadines | 0.0 /100 | #302 | Tragic 2.8% |
| Immigrants | Belize | 0.0 /100 | #303 | Tragic 2.8% |
| Cree | 0.0 /100 | #304 | Tragic 2.8% |
Demographics Similar to Immigrants from Croatia by Self-Care Disability
In terms of self-care disability, the demographic groups most similar to Immigrants from Croatia are Sri Lankan (2.4%, a difference of 0.0%), Austrian (2.4%, a difference of 0.050%), South American Indian (2.4%, a difference of 0.070%), Immigrants from Uruguay (2.4%, a difference of 0.12%), and Laotian (2.4%, a difference of 0.13%).
| Demographics | Rating | Rank | Self-Care Disability |
| Poles | 88.9 /100 | #131 | Excellent 2.4% |
| Immigrants | South America | 88.8 /100 | #132 | Excellent 2.4% |
| Immigrants | Colombia | 88.5 /100 | #133 | Excellent 2.4% |
| Russians | 88.2 /100 | #134 | Excellent 2.4% |
| Laotians | 87.8 /100 | #135 | Excellent 2.4% |
| South American Indians | 87.2 /100 | #136 | Excellent 2.4% |
| Austrians | 87.0 /100 | #137 | Excellent 2.4% |
| Immigrants | Croatia | 86.6 /100 | #138 | Excellent 2.4% |
| Sri Lankans | 86.6 /100 | #139 | Excellent 2.4% |
| Immigrants | Uruguay | 85.4 /100 | #140 | Excellent 2.4% |
| Alaska Natives | 84.5 /100 | #141 | Excellent 2.4% |
| Immigrants | Peru | 83.2 /100 | #142 | Excellent 2.4% |
| Afghans | 82.3 /100 | #143 | Excellent 2.4% |
| Costa Ricans | 80.8 /100 | #144 | Excellent 2.4% |
| Germans | 80.1 /100 | #145 | Excellent 2.4% |