West Indian vs Indian (Asian) Householder Income Ages 45 - 64 years
COMPARE
West Indian
Indian (Asian)
Householder Income Ages 45 - 64 years
Householder Income Ages 45 - 64 years Comparison
West Indians
Indians (Asian)
$89,906
HOUSEHOLDER INCOME AGES 45 - 64 YEARS
0.5/ 100
METRIC RATING
255th/ 347
METRIC RANK
$122,343
HOUSEHOLDER INCOME AGES 45 - 64 YEARS
100.0/ 100
METRIC RATING
14th/ 347
METRIC RANK
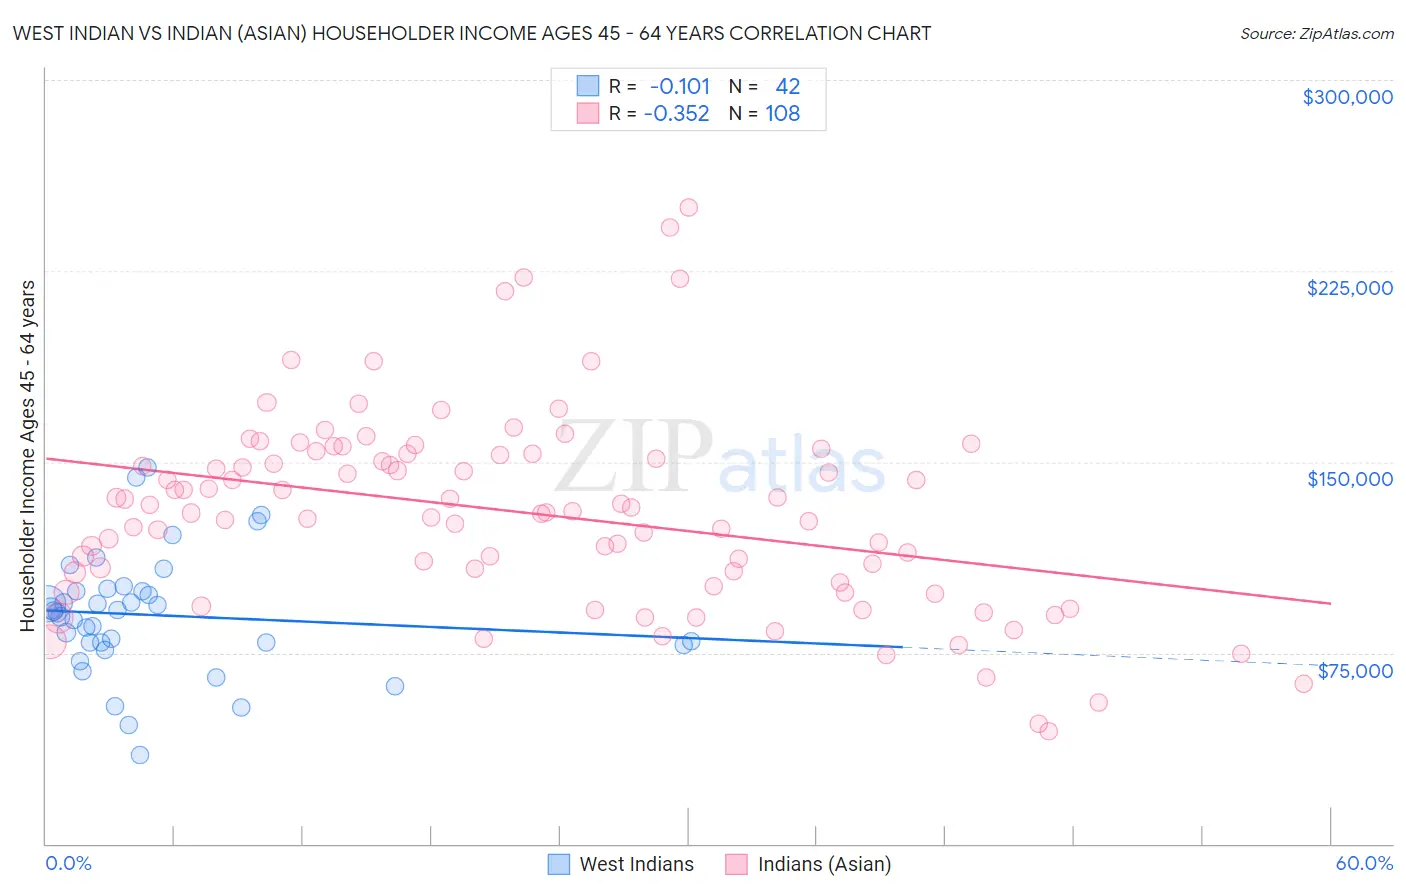
West Indian vs Indian (Asian) Householder Income Ages 45 - 64 years Correlation Chart
The statistical analysis conducted on geographies consisting of 253,646,357 people shows a poor negative correlation between the proportion of West Indians and household income with householder between the ages 45 and 64 in the United States with a correlation coefficient (R) of -0.101 and weighted average of $89,906. Similarly, the statistical analysis conducted on geographies consisting of 493,767,636 people shows a mild negative correlation between the proportion of Indians (Asian) and household income with householder between the ages 45 and 64 in the United States with a correlation coefficient (R) of -0.352 and weighted average of $122,343, a difference of 36.1%.
Householder Income Ages 45 - 64 years Correlation Summary
| Measurement | West Indian | Indian (Asian) |
| Minimum | $34,699 | $44,167 |
| Maximum | $147,760 | $250,001 |
| Range | $113,061 | $205,834 |
| Mean | $89,808 | $130,085 |
| Median | $91,034 | $130,239 |
| Interquartile 25% (IQ1) | $78,920 | $104,628 |
| Interquartile 75% (IQ3) | $99,241 | $152,944 |
| Interquartile Range (IQR) | $20,321 | $48,316 |
| Standard Deviation (Sample) | $23,506 | $38,442 |
| Standard Deviation (Population) | $23,224 | $38,264 |
Similar Demographics by Householder Income Ages 45 - 64 years
Demographics Similar to West Indians by Householder Income Ages 45 - 64 years
In terms of householder income ages 45 - 64 years, the demographic groups most similar to West Indians are French American Indian ($89,811, a difference of 0.11%), Immigrants from Guyana ($90,186, a difference of 0.31%), Barbadian ($90,266, a difference of 0.40%), German Russian ($89,398, a difference of 0.57%), and Immigrants from Barbados ($89,394, a difference of 0.57%).
| Demographics | Rating | Rank | Householder Income Ages 45 - 64 years |
| Immigrants | Laos | 0.9 /100 | #248 | Tragic $90,909 |
| Mexican American Indians | 0.8 /100 | #249 | Tragic $90,811 |
| Sub-Saharan Africans | 0.8 /100 | #250 | Tragic $90,691 |
| Americans | 0.7 /100 | #251 | Tragic $90,536 |
| Marshallese | 0.7 /100 | #252 | Tragic $90,455 |
| Barbadians | 0.6 /100 | #253 | Tragic $90,266 |
| Immigrants | Guyana | 0.6 /100 | #254 | Tragic $90,186 |
| West Indians | 0.5 /100 | #255 | Tragic $89,906 |
| French American Indians | 0.5 /100 | #256 | Tragic $89,811 |
| German Russians | 0.4 /100 | #257 | Tragic $89,398 |
| Immigrants | Barbados | 0.4 /100 | #258 | Tragic $89,394 |
| Immigrants | Nicaragua | 0.4 /100 | #259 | Tragic $89,108 |
| Liberians | 0.3 /100 | #260 | Tragic $88,929 |
| Belizeans | 0.3 /100 | #261 | Tragic $88,684 |
| Somalis | 0.3 /100 | #262 | Tragic $88,600 |
Demographics Similar to Indians (Asian) by Householder Income Ages 45 - 64 years
In terms of householder income ages 45 - 64 years, the demographic groups most similar to Indians (Asian) are Immigrants from Eastern Asia ($122,222, a difference of 0.10%), Immigrants from China ($122,178, a difference of 0.14%), Immigrants from Ireland ($122,757, a difference of 0.34%), Immigrants from Israel ($122,893, a difference of 0.45%), and Burmese ($121,444, a difference of 0.74%).
| Demographics | Rating | Rank | Householder Income Ages 45 - 64 years |
| Immigrants | Hong Kong | 100.0 /100 | #7 | Exceptional $127,500 |
| Immigrants | Iran | 100.0 /100 | #8 | Exceptional $126,940 |
| Okinawans | 100.0 /100 | #9 | Exceptional $124,796 |
| Immigrants | South Central Asia | 100.0 /100 | #10 | Exceptional $124,188 |
| Cypriots | 100.0 /100 | #11 | Exceptional $123,396 |
| Immigrants | Israel | 100.0 /100 | #12 | Exceptional $122,893 |
| Immigrants | Ireland | 100.0 /100 | #13 | Exceptional $122,757 |
| Indians (Asian) | 100.0 /100 | #14 | Exceptional $122,343 |
| Immigrants | Eastern Asia | 100.0 /100 | #15 | Exceptional $122,222 |
| Immigrants | China | 100.0 /100 | #16 | Exceptional $122,178 |
| Burmese | 100.0 /100 | #17 | Exceptional $121,444 |
| Immigrants | Korea | 100.0 /100 | #18 | Exceptional $121,243 |
| Eastern Europeans | 100.0 /100 | #19 | Exceptional $120,684 |
| Immigrants | Australia | 100.0 /100 | #20 | Exceptional $119,308 |
| Immigrants | Sri Lanka | 100.0 /100 | #21 | Exceptional $119,094 |